Use CLI
KubeSkoop connectivity diagnostics provides a way to directly run from the command line, allowing you to diagnose the cluster on your local computer.
By default, when diagnosis finished, it will print simple link info and diagnose result to standard output. You can specify --http or --format to view result via Web UI, or save it into a specified format.
Diagnose the cluster
Execute the following command to make a connectivity diagnosis task from 172.18.0.4 to 10.96.0.10, port 80, and TCP protocol(by default).
skoop -s 172.18.0.4 -d 10.96.0.10 -p 80
When the diagnosis is complete, the packet path and the problems found will be output to the screen.
$ skoop -s 172.18.0.4 -d 10.96.0.10 -p 53
Packet path:
"default/netshoot-6bddd57fb7-49q9s" -> "node1" [label="type=veth,level=0,trans=service,oif=eth0,iif=cni0,src=172.18.0.4,dst=10.96.0.10,dport=53"]
"node1" -> "kube-system/coredns-547b98dbcc-dxmnl" [label="type=veth,level=1,trans=serve,oif=cni0,iif=eth0,src=172.18.0.4,dst=172.18.0.2,dport=53",arrowhead="dot"]
"node1" -> "node2" [label="type=infra,level=1,trans=forward,oif=eth0,iif=eth0,src=172.18.0.4,dst=172.18.0.69,dport=53"]
"node2" -> "kube-system/coredns-547b98dbcc-zr2zl" [label="type=veth,level=2,trans=serve,oif=cni0,iif=eth0,src=172.18.0.4,dst=172.18.0.69,dport=53",arrowhead="dot"]


Suspicions on node "kube-system/coredns-547b98dbcc-zr2zl"
[FATAL] no process listening on 0.0.0.0:80 or 172.18.0.69:80 protocol tcp
View diagnosis result through web
By adding the --http parameter to the command line, an HTTP server will be launched for viewing the diagnosis results interactively.
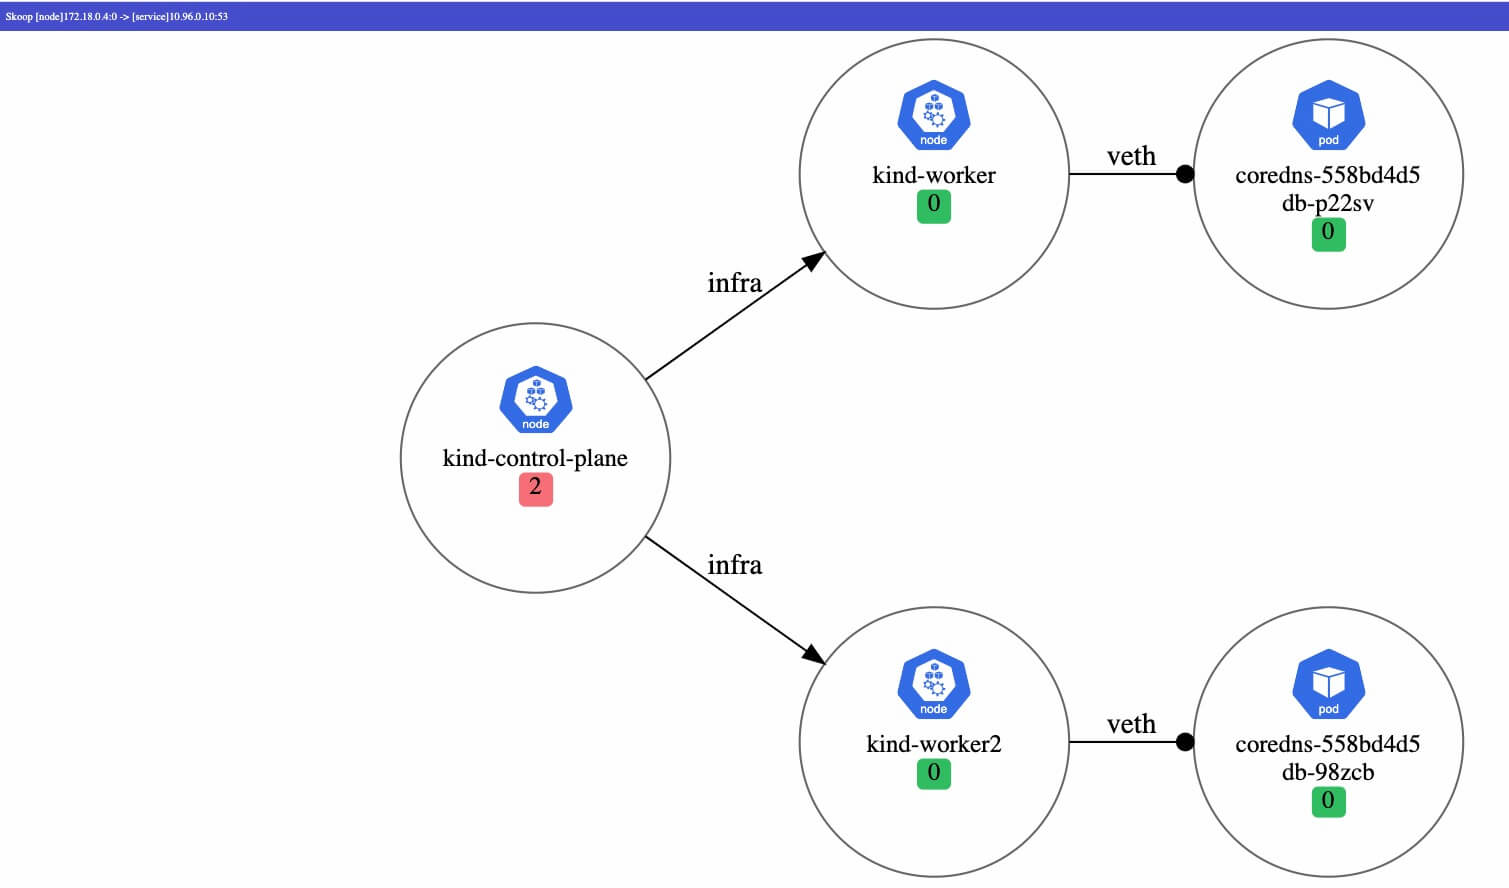
When the --http parameter is used, after the diagnosis completed, an HTTP server is started to accept requests at the specified address, which you can open to view the link graph and final results.
$ skoop -s 172.18.0.4 -d 10.96.0.10 -p 53 --http
I0118 11:43:23.383446    6280 web.go:97] HTTP server listening on http://127.0.0.1:8080
The server is started on 127.0.0.1:8080 by default, you can also specify the address with the --http-address parameter.
If you are running diagnostics in Docker container or on a remote server, you may need to set --http-address to 0.0.0.0:8080 for remote address access. Take Docker as an example:
docker run -p 8080:8080 -v ~/.kube:/root/.kube kubeskoop/kubeskoop:latest skoop -s 172.18.0.4 -d 10.96.0.10 -p 80 --http --http-address=0.0.0.0:8080
After opening http://127.0.0.1:8080 through your browser, you can see the diagnostic results:

Output format
You can specify the output format with the --format parameter.
If you do not specify the output format, it will output simple link information and diagnostic results in the standard output by default when the diagnosis is finished.
Currently, d2, svg, json output is supported.
In addition, you can use --output to specify the output filename (defaults to result.d2/svg/json), and can also specify - to indicate output to standard output.
d2
Output format d2. For more information about d2 syntax, please refer to the documentation.
This output format contains only the generated link information and does not contain the diagnosis result.
svg
Output format svg, generated by d2 file.
This output format contains only the generated link information and does not contain the diagnosis result.
json
Output format json. The json output format contains details of the nodes and edges in the link graph, as well as the diagnosis result in cluster.
Specify the cloud provider
KubeSkoop supports specifying the cloud provider to provide diagnosis for resource configuration on the cloud.
After specifying the cloud provider via the --cloud-provider parameter,
Connectivity Diagnostics will check the on-cloud resource configurations such as VM security groups, routing tables, NAT, etc.
Currently supported cloud providers and the extra arguments needed, please refer to the documentation.
Other command line arguments
You can use the --help parameter to see the rest of the parameters and their usage, or refer to the documentation.