Intro
KubeSkoop connectivity diagnosis provides one-shot diagnose for persistent network failure.
It can detect network misconfiguration(network device status, iptables rules, VM security group rules, and more) for various endpoint types and links(Pod, Service, Node, Ingress/Egress traffic) in Kubernetes cluster. It also supports detecting IaaS misconfiguration for various cloud providers.
How it works
When run KubeSkoop connectivity diagnosis, it generates traffic graph from source address to destination address by the network plugin and cloud provider of your cluster. Then, it collects network stack information (iptables rules, network device info, sysctls, etc.) on nodes.
When build traffic links, it will evaluate links and edges in the graph to check whether it works as expected. If not, it will be considered as a misconfiguration.
Use Connectivity Diagnosis
via Web Console
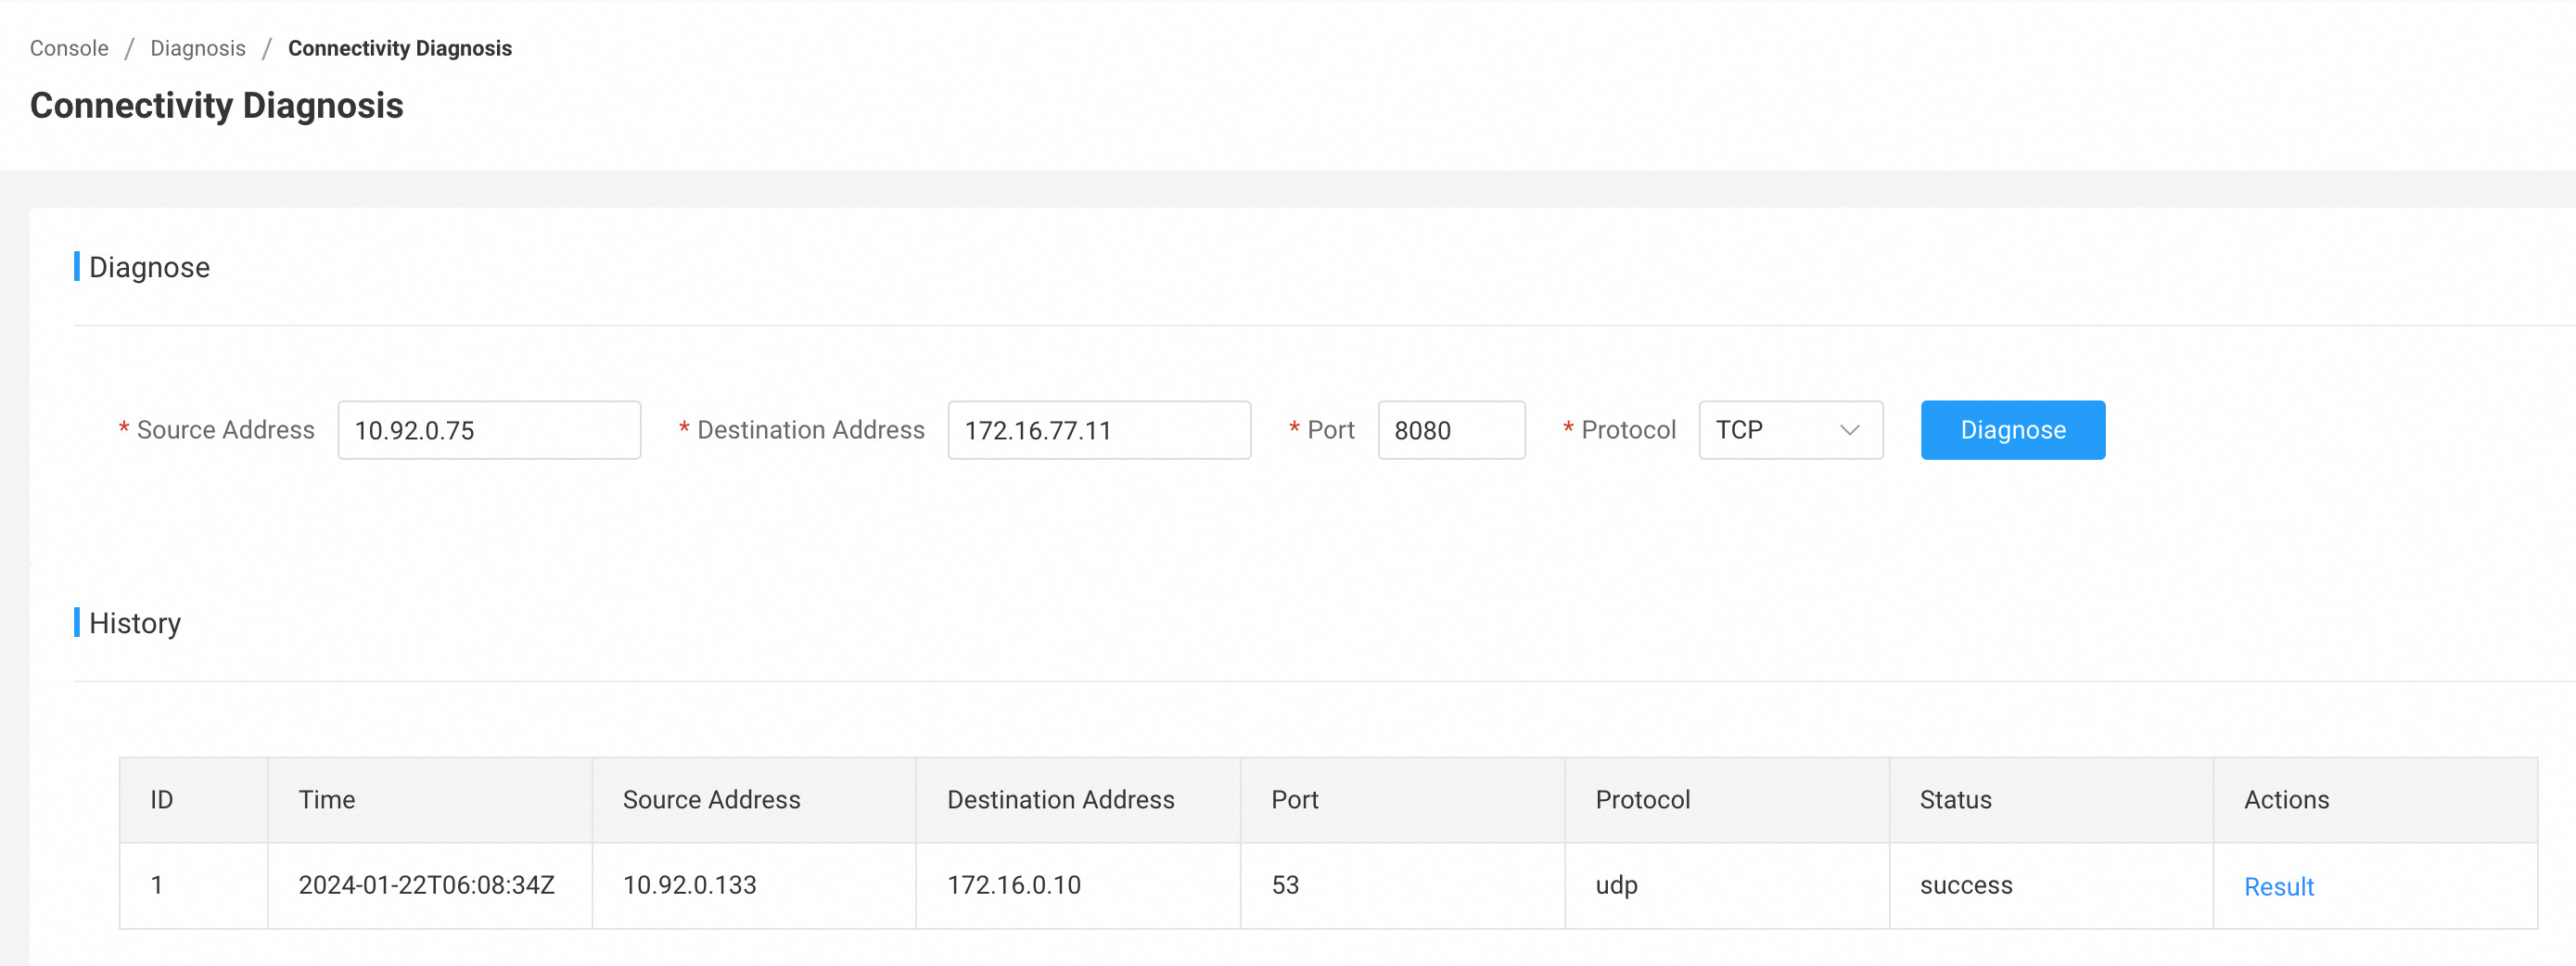
Connectivity diagnostics can be triggered on web console.
via CLI
See Use CLI.
Limitations
KubeSkoop connectivity diagnosis feature relies on the implementation of the network plugin the cluster is using, and you can find it here to see a list of currently supported network plugins.
To also diagnose for configurations on the cloud, you can find a list of implemented cloud providers here.