Network Graph
You need to use this feature in Web Console.
This feature relies on the flow probe for the basic function, and packetloss and tcpretrans probes for packet drop and TCP retransmission statistics.
KubeSkoop provides network graph feature that allows you to view the network statistics between network endpoints in the cluster at a certain time range. By default, it shows the network graph for the last 15 minutes.
You can view the network graph on the homepage of the web console or on the Monitoring - Network Graph page.
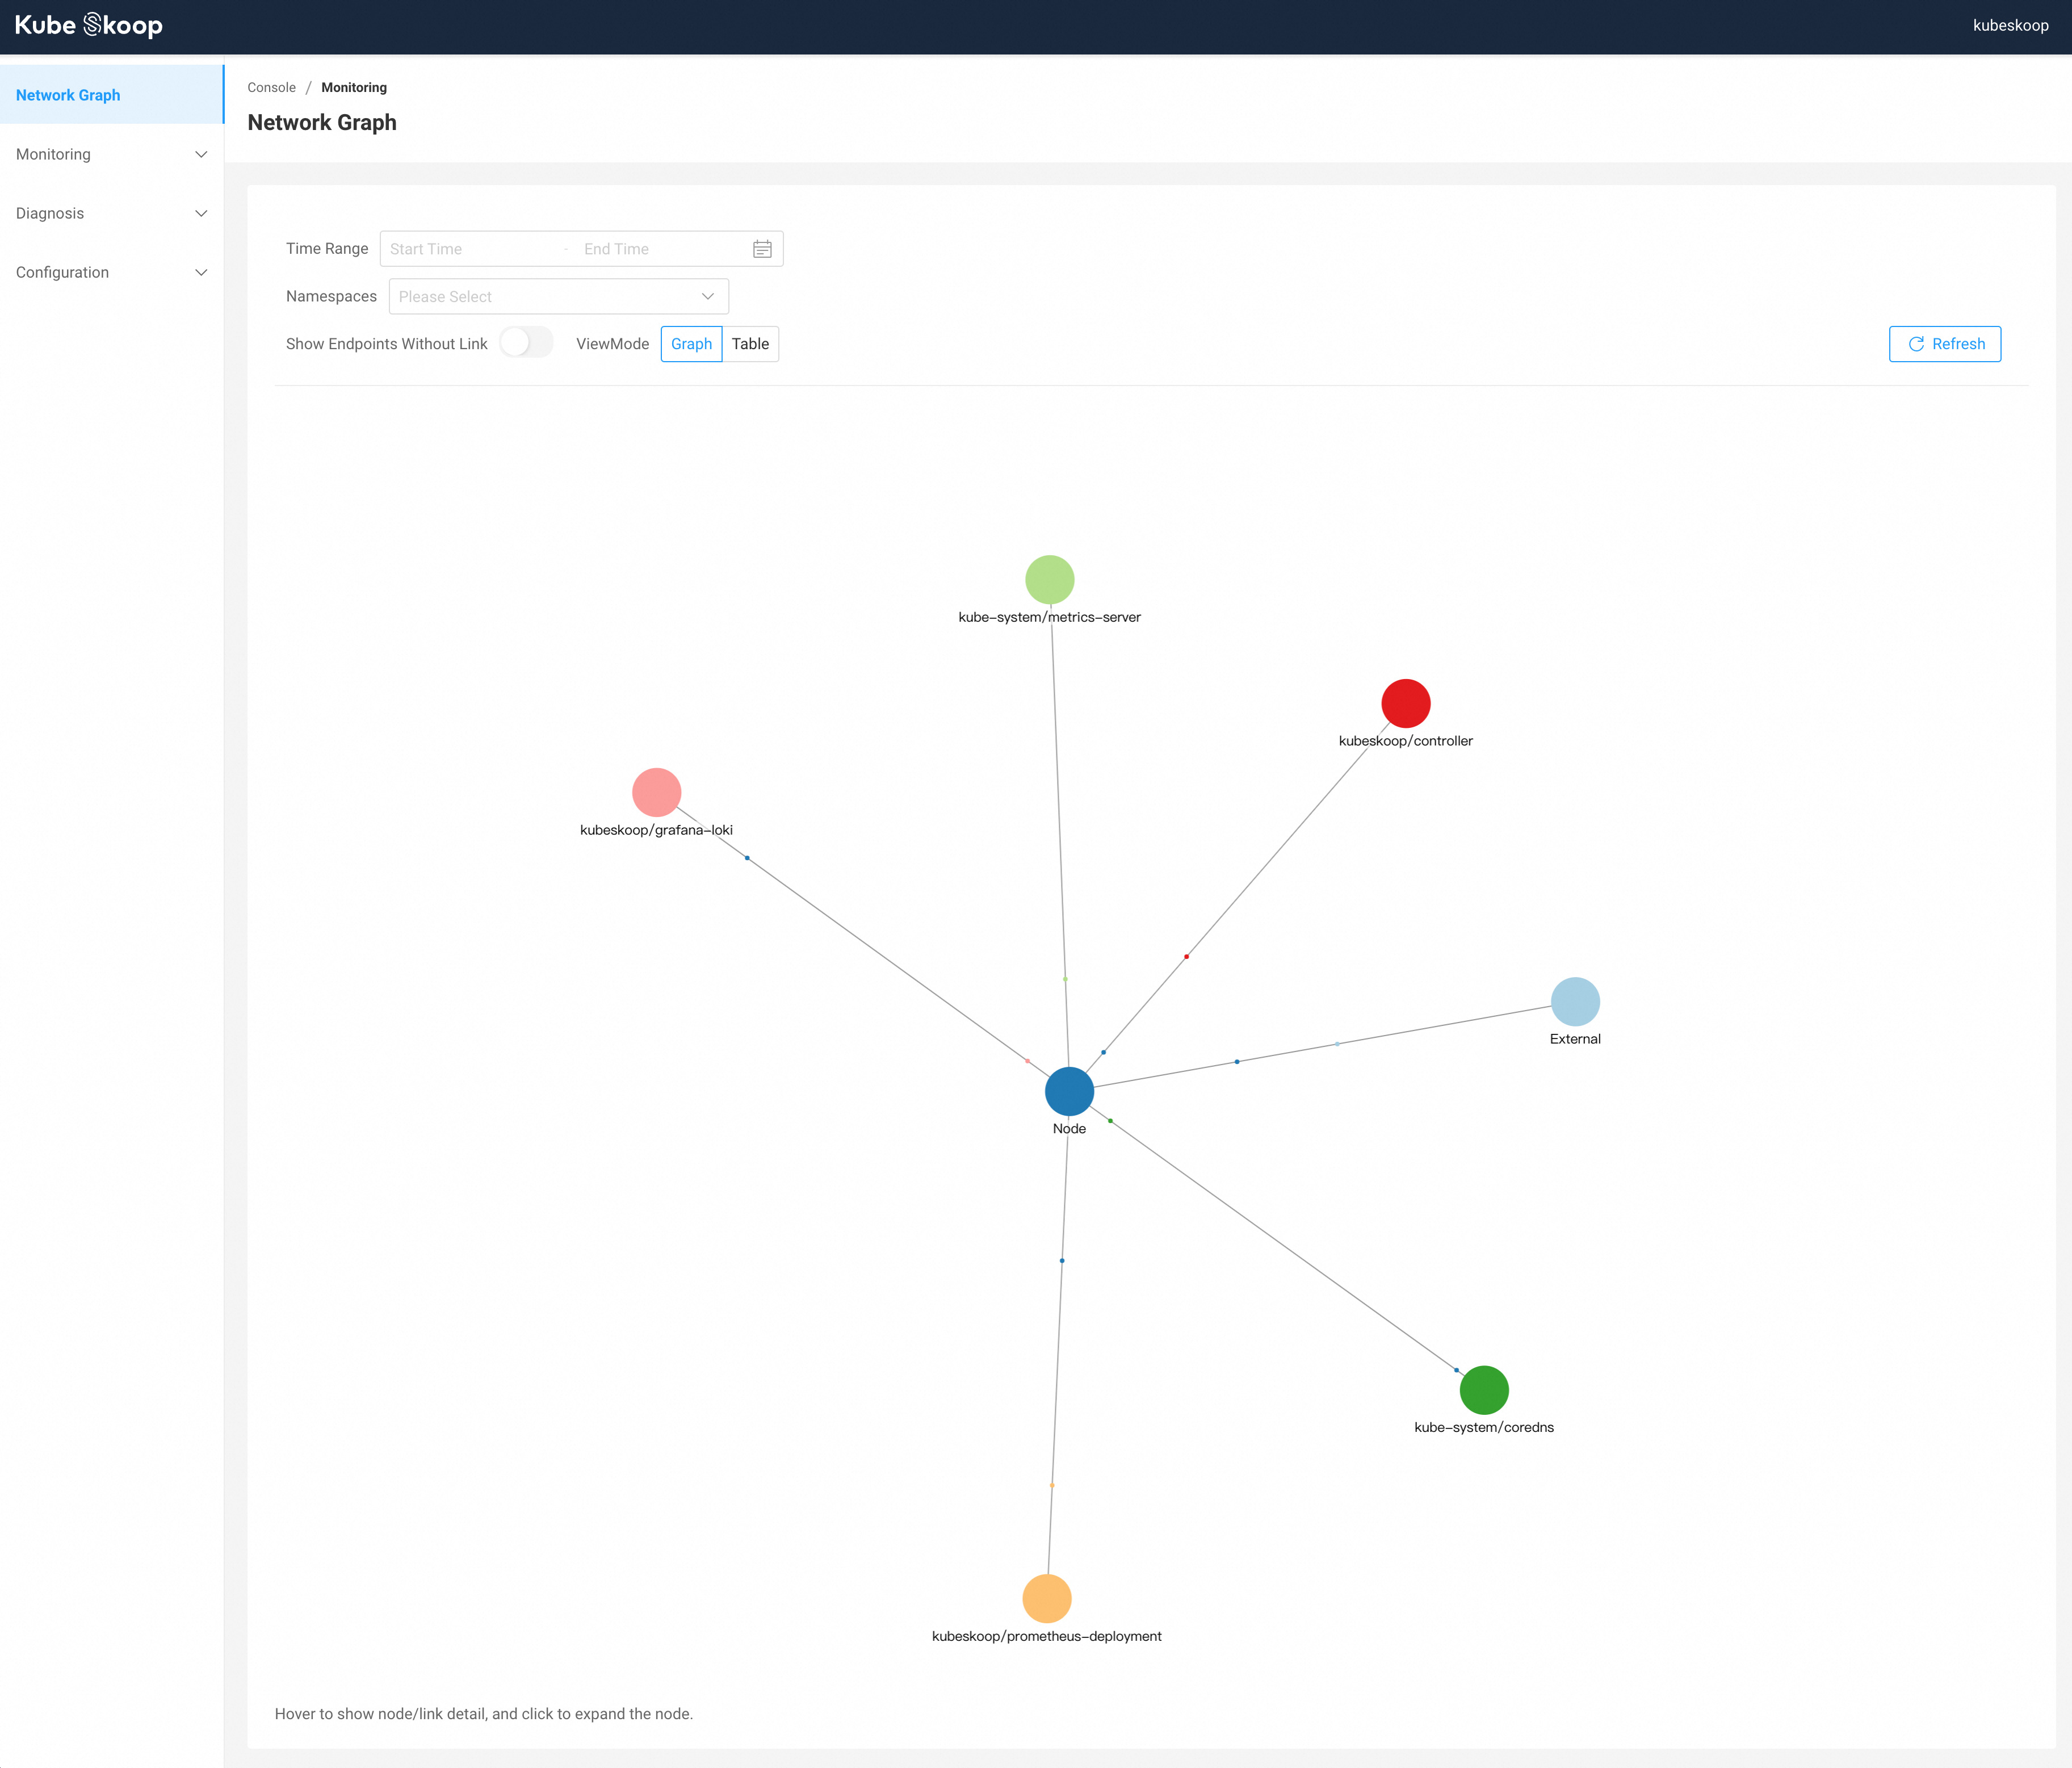
Endpoints will be grouped by deployment/daemonset/node/external. Endpoints without any links will be hidden by default, you can show them by enabling Show Endpoints Without Link.
The network graph will not be auto-updated once you enter the page, you can click the Refresh button to refresh the graph.
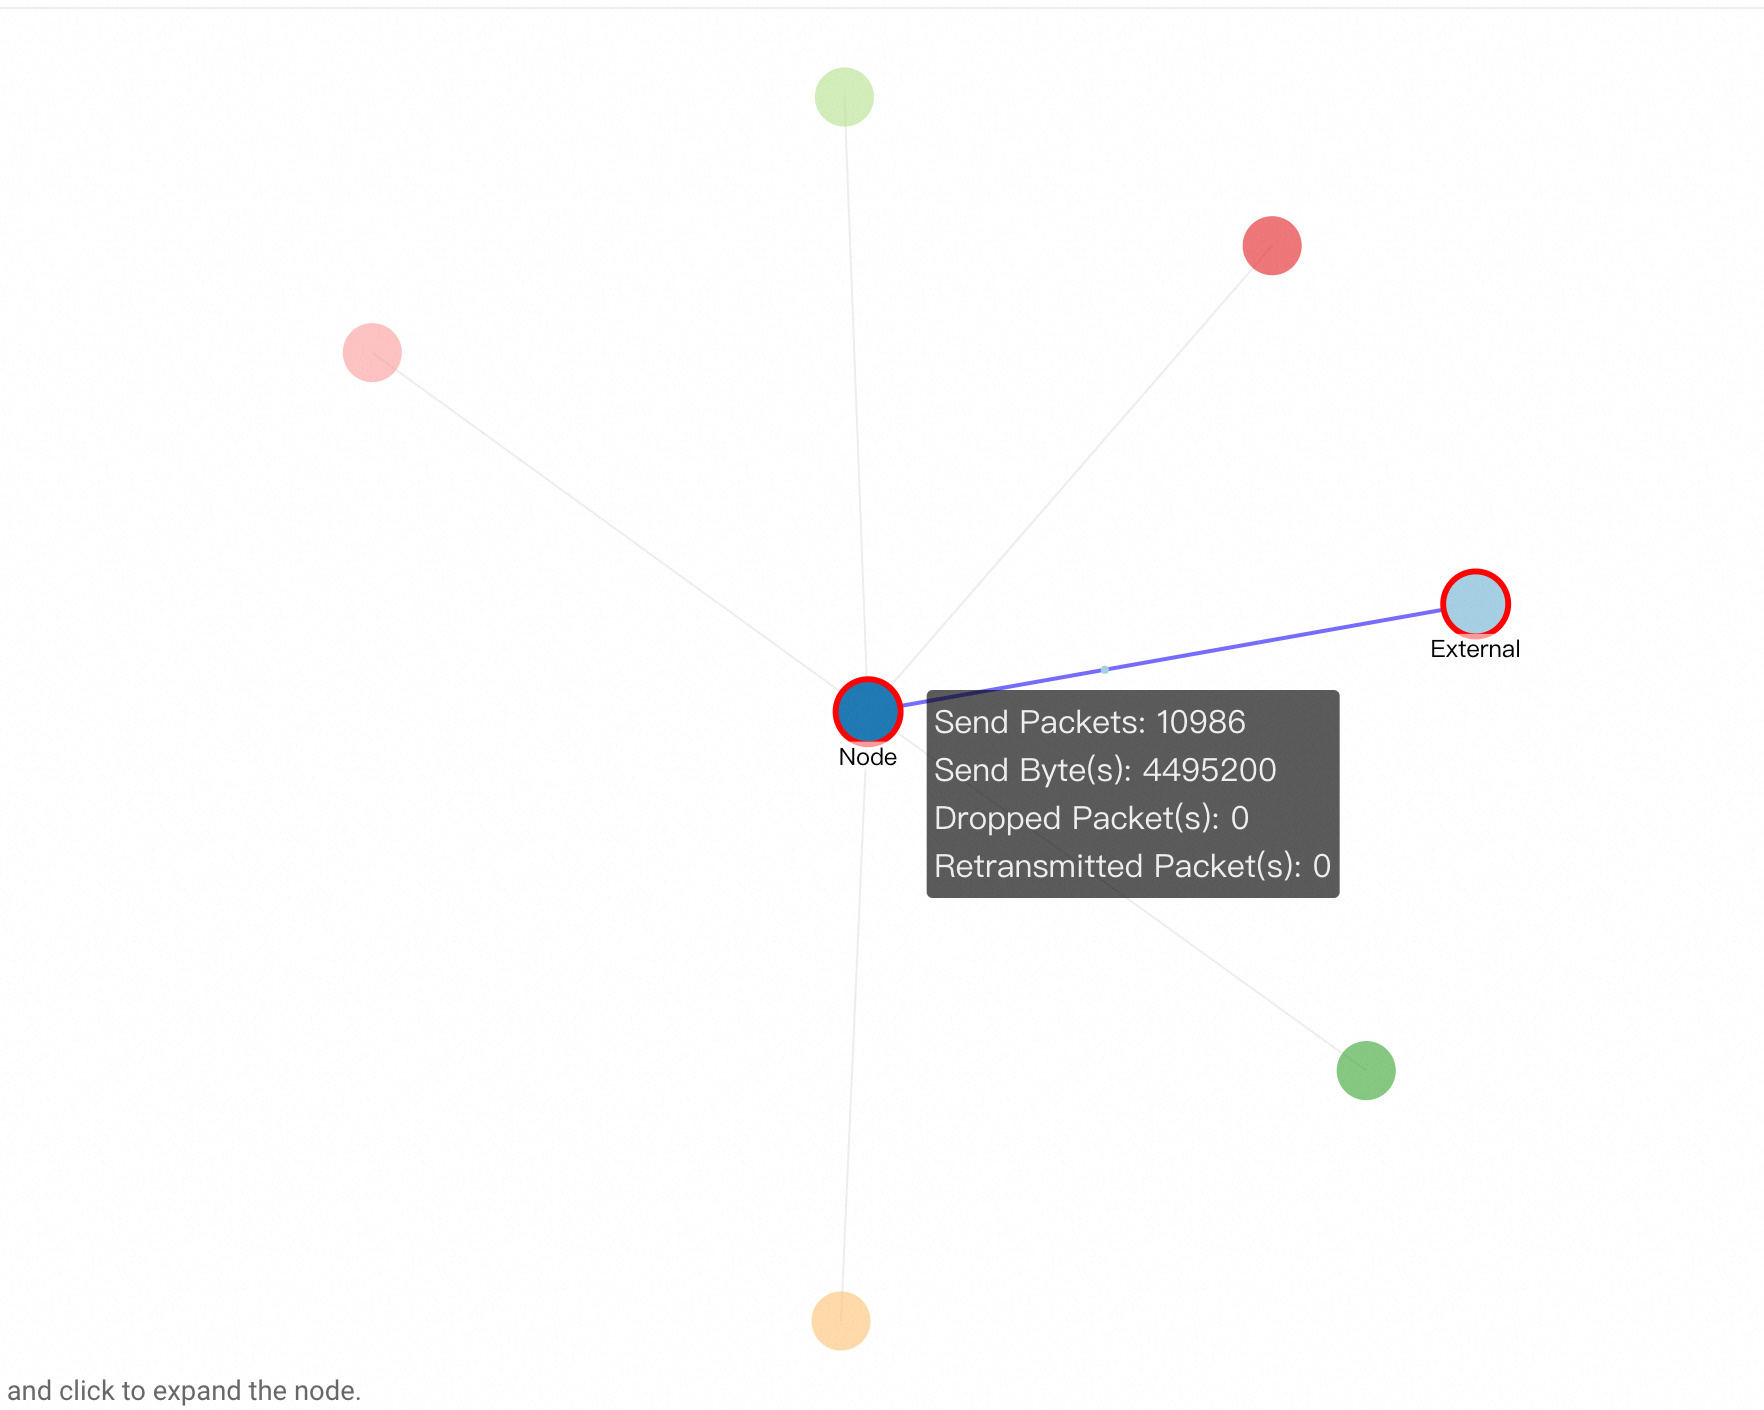
Hovering over a node or a link will show the detailed information on this, including the node/link name, the node type, and the connection statistics.
Show network graph from historical time range
The Time Range selector allows you to query link information from a particular time range from history.
Filter endpoints by namespaces
You can filter endpoints by namespaces using the Namespaces selector. If no selection is made, endpoints under all namespaces are displayed by default.
Expand and collapse nodes
You can expand node by clicking it to see detailed information for every node in the group. You can also collapse nodes by clicking the expanded nodes again.
View detailed link information
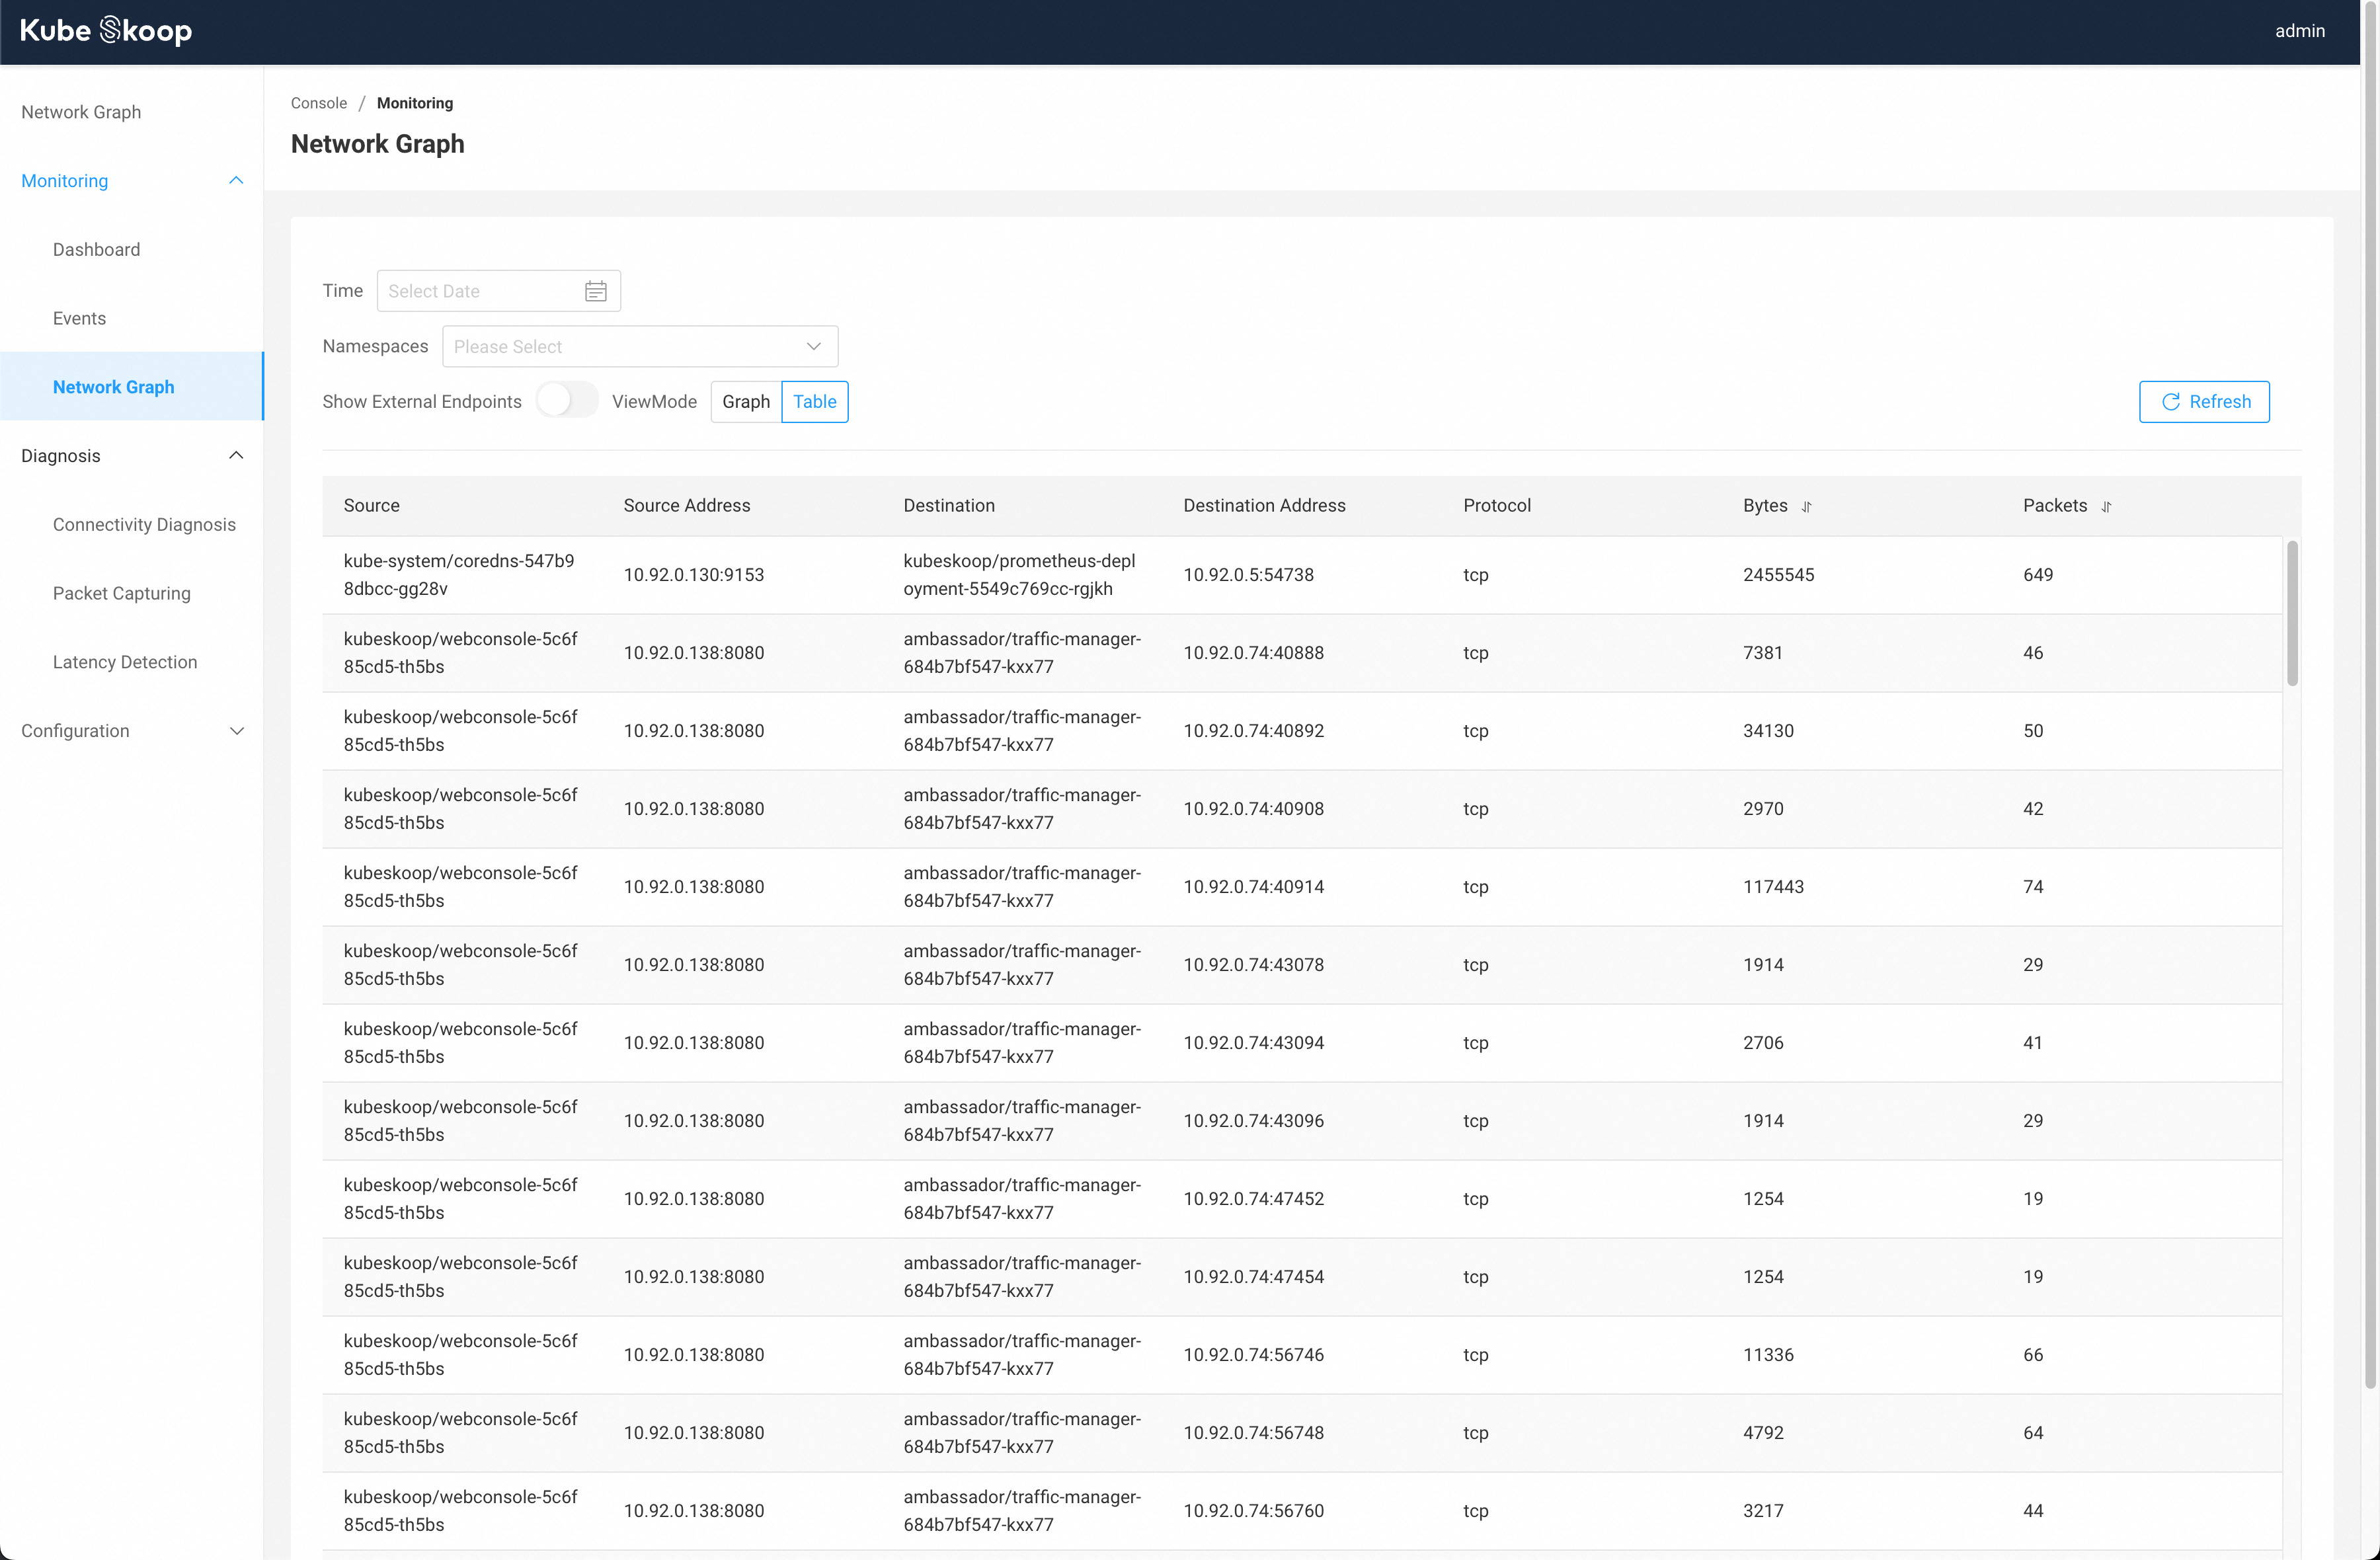
By switching ViewMode to Table mode, detailed link information can be viewed in table.
In addition to the source and destination nodes, more details such as IP, port, connection traffic, etc. are displayed.