Web Console
KubeSkoop provides a user-friendly web console that can be deployed directly into the cluster. It provides the following features:
- Diagnosis
- Connectivity Diagnosis
- Packet Capturing
- Latency Detection
- Monitoring
- Performance Dashboard
- Anomaly Events
- Network Graph
- Configuration
- Node Configuration
Cluster Network Monitoring
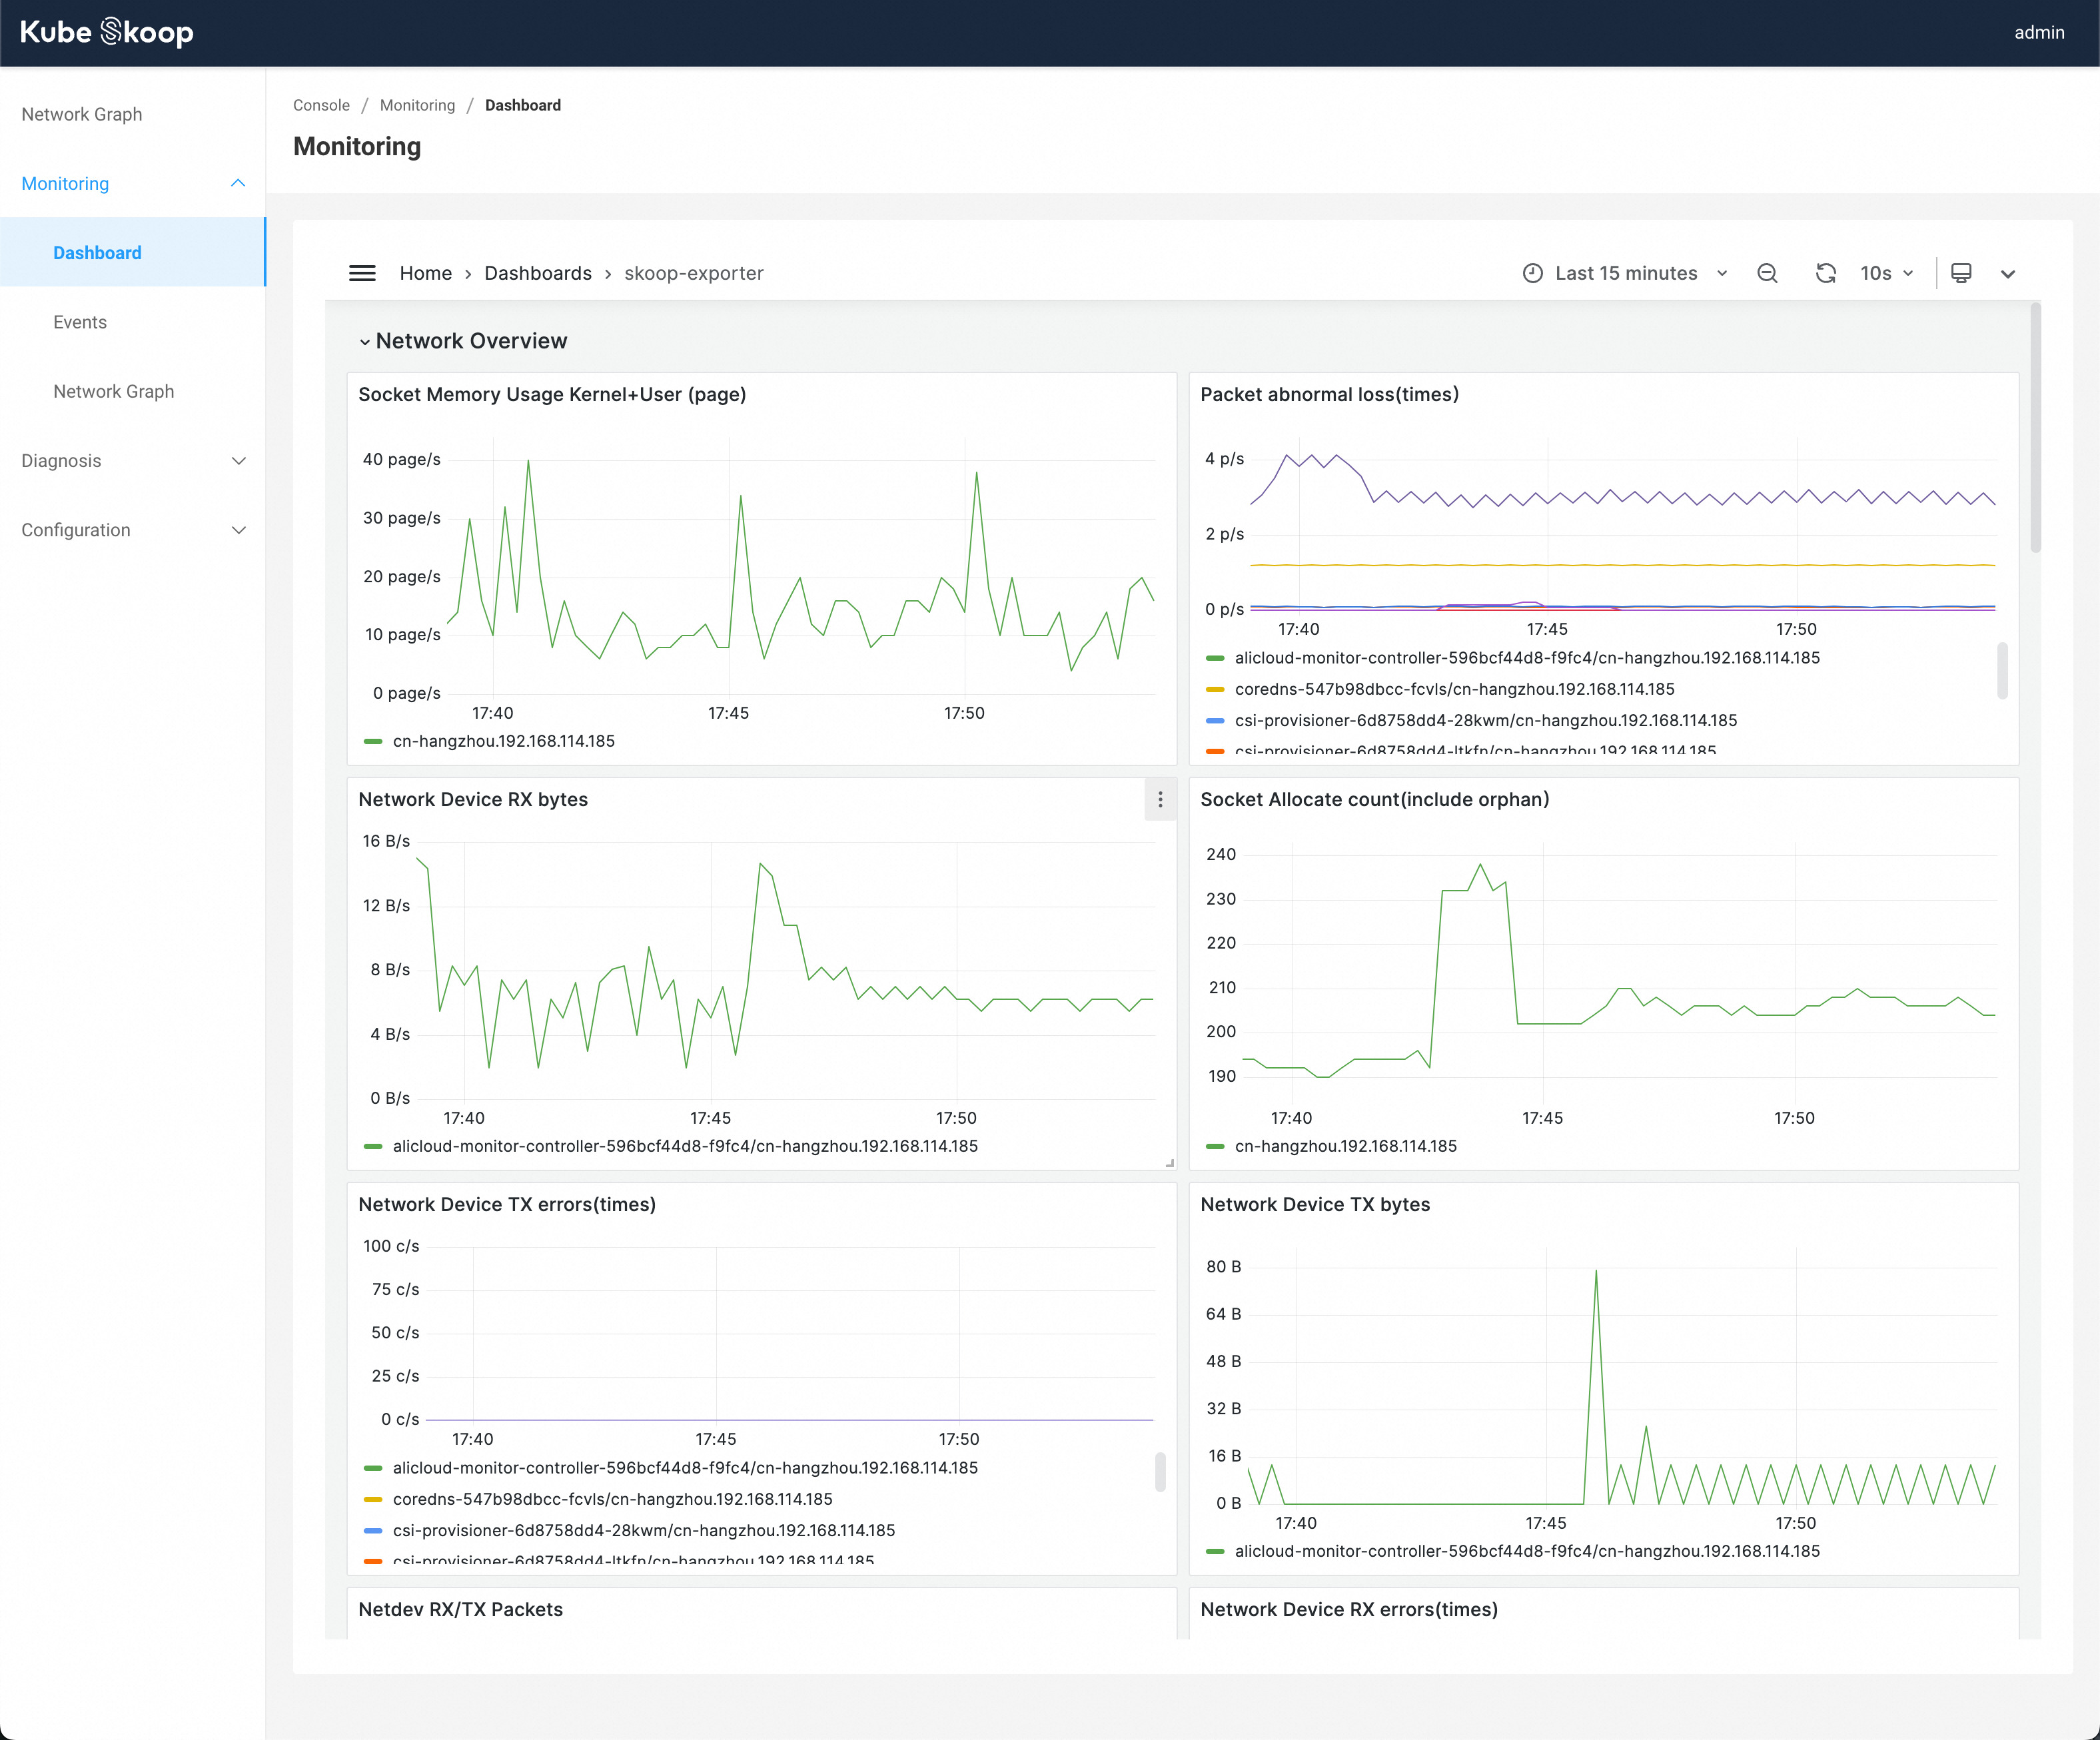
Network Performance Dashboard
Under Monitoring - Dashboard, you can access the dashboard of the cluster network, from which you can query the depth metric corresponding to the time point of the performance problem.
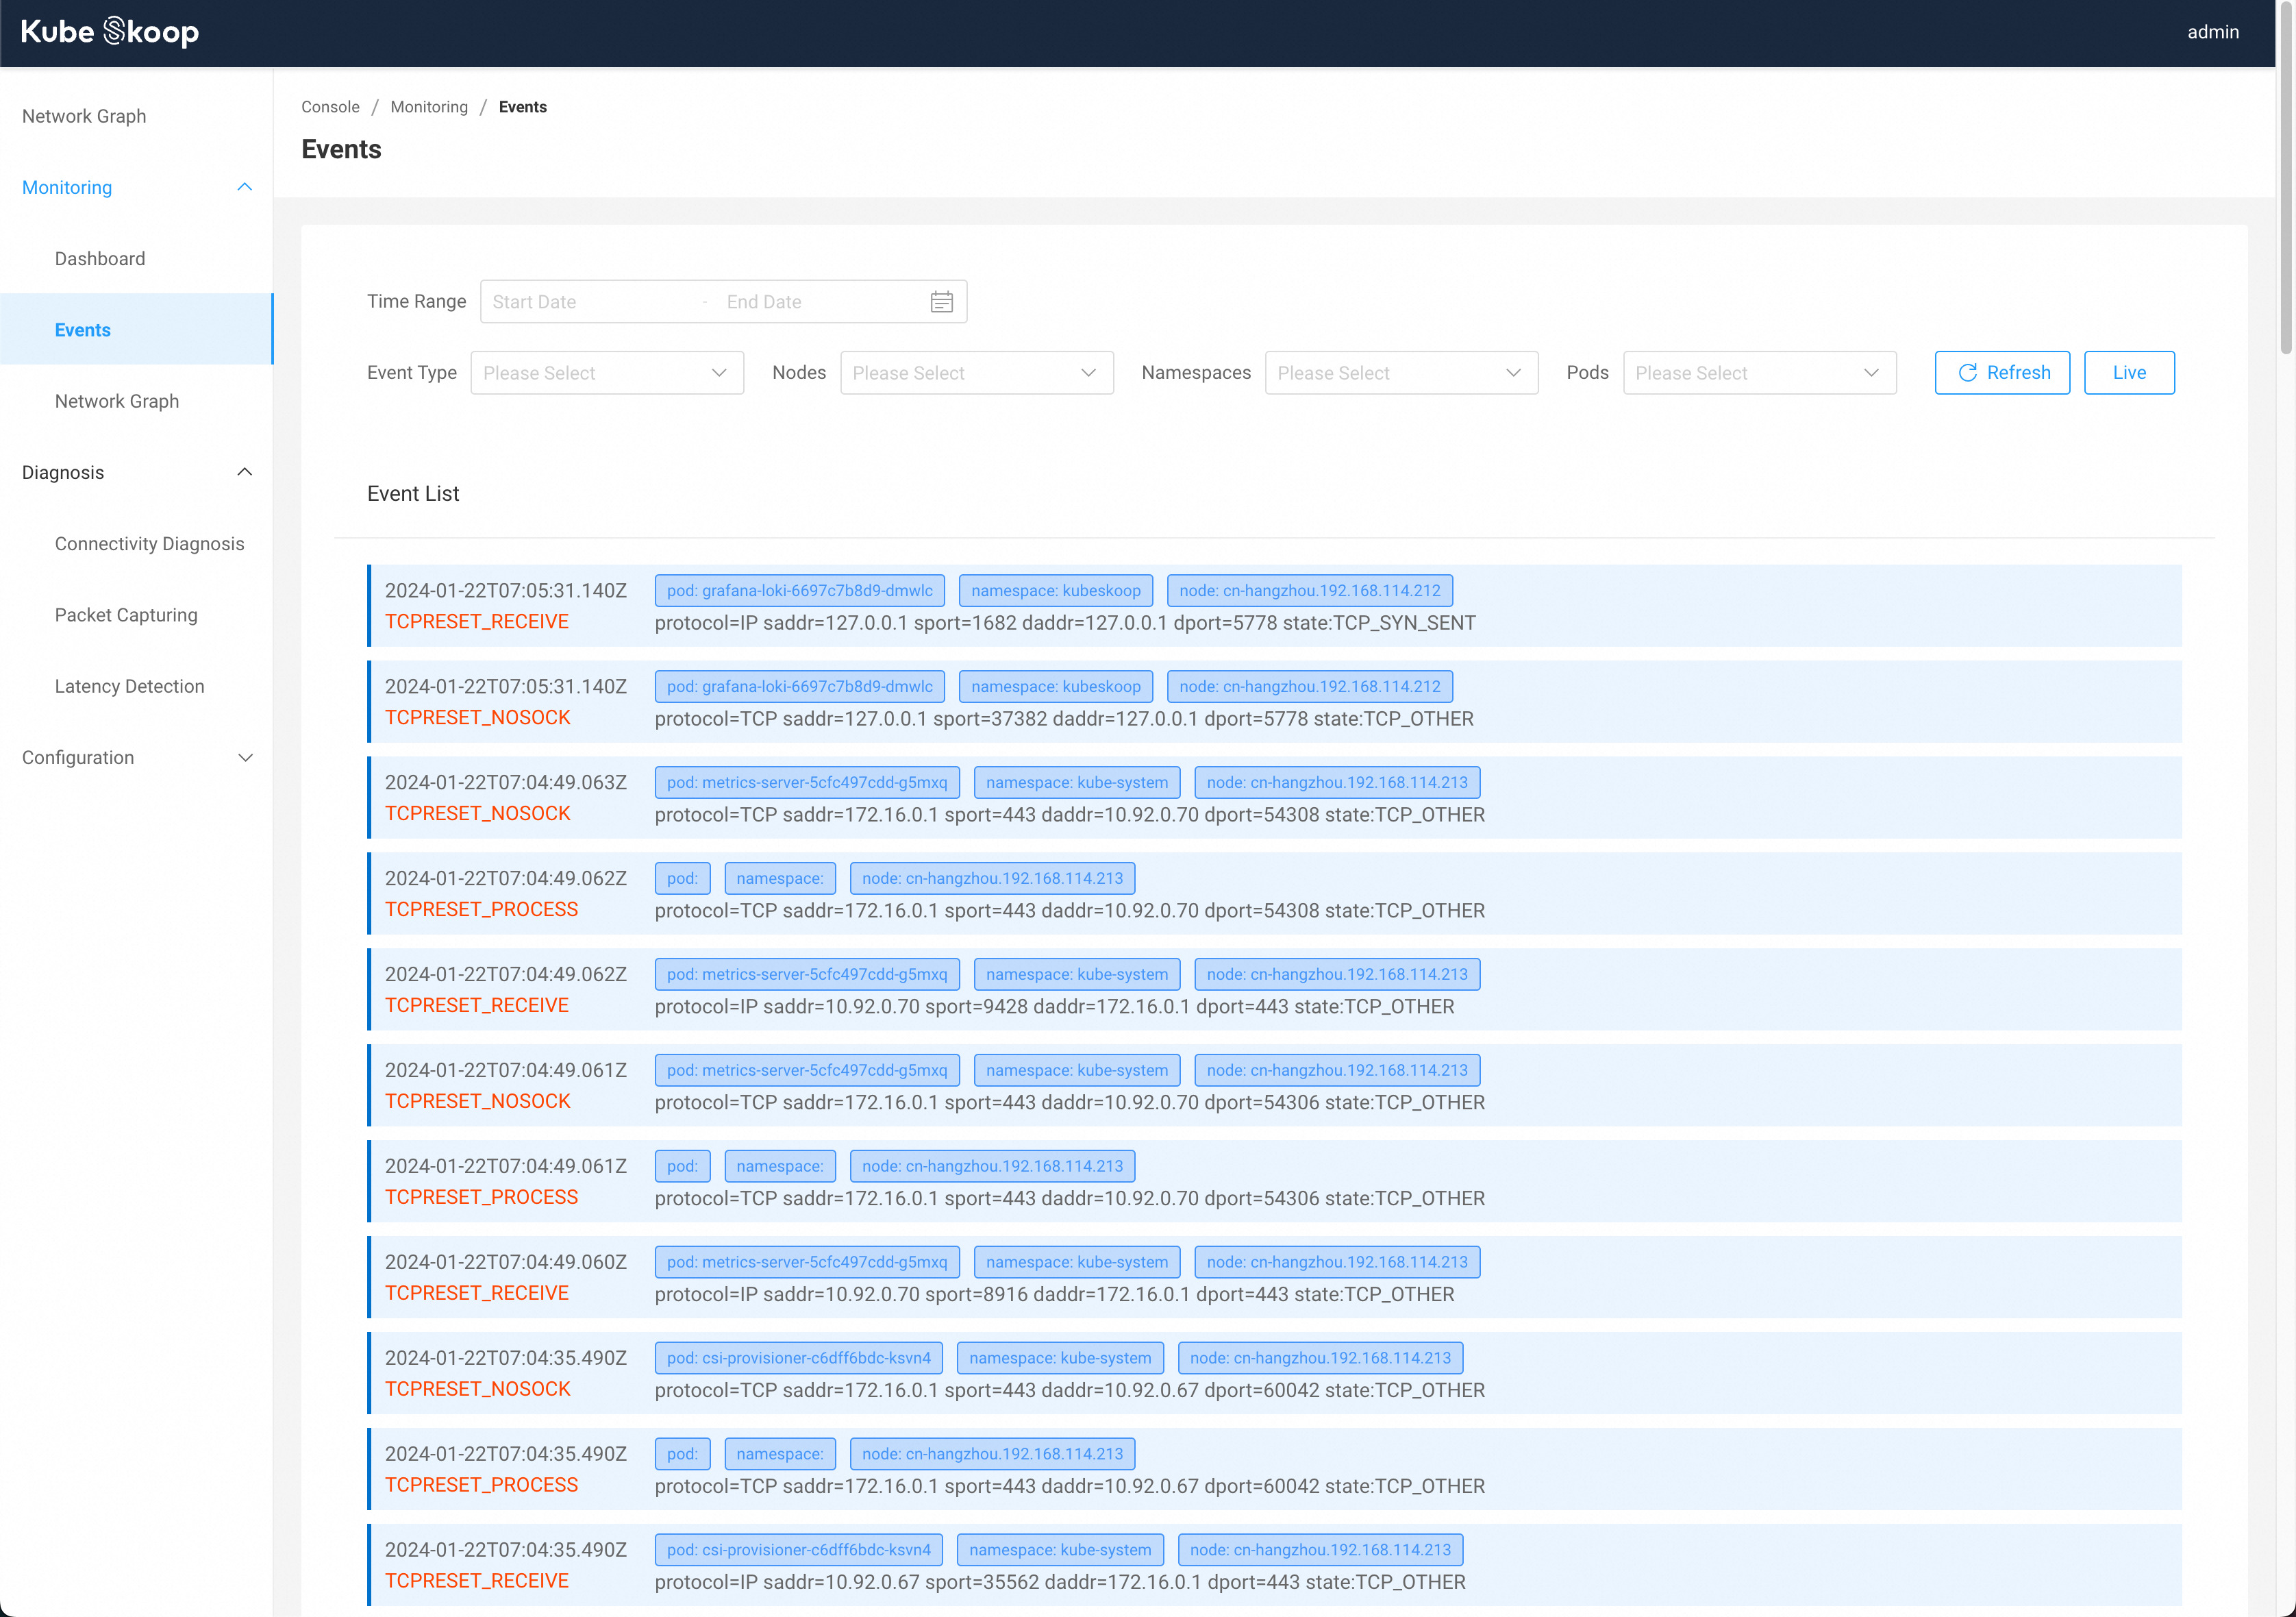
Network Anomaly Events
Under Monitoring - Event, you can view the anomaly events in the cluster at the current time.
You can also manually select time range, or filter based on event type, node, or the Pod namespace/name.
By clicking Live in the upper right corner, you can monitor events within the cluster in real time based on the current filtering criteria.
Network Graph
See Network Graph.
Diagnosis
Connectivity Diagnosis
Packet Capturing
See Packet Capturing.
Latency Detection
See Latency Detection.
Configuration
Node Configuration
Under Network - Configuration - Node Configuration, you can configure the KubeSkoop Agents in the cluster.
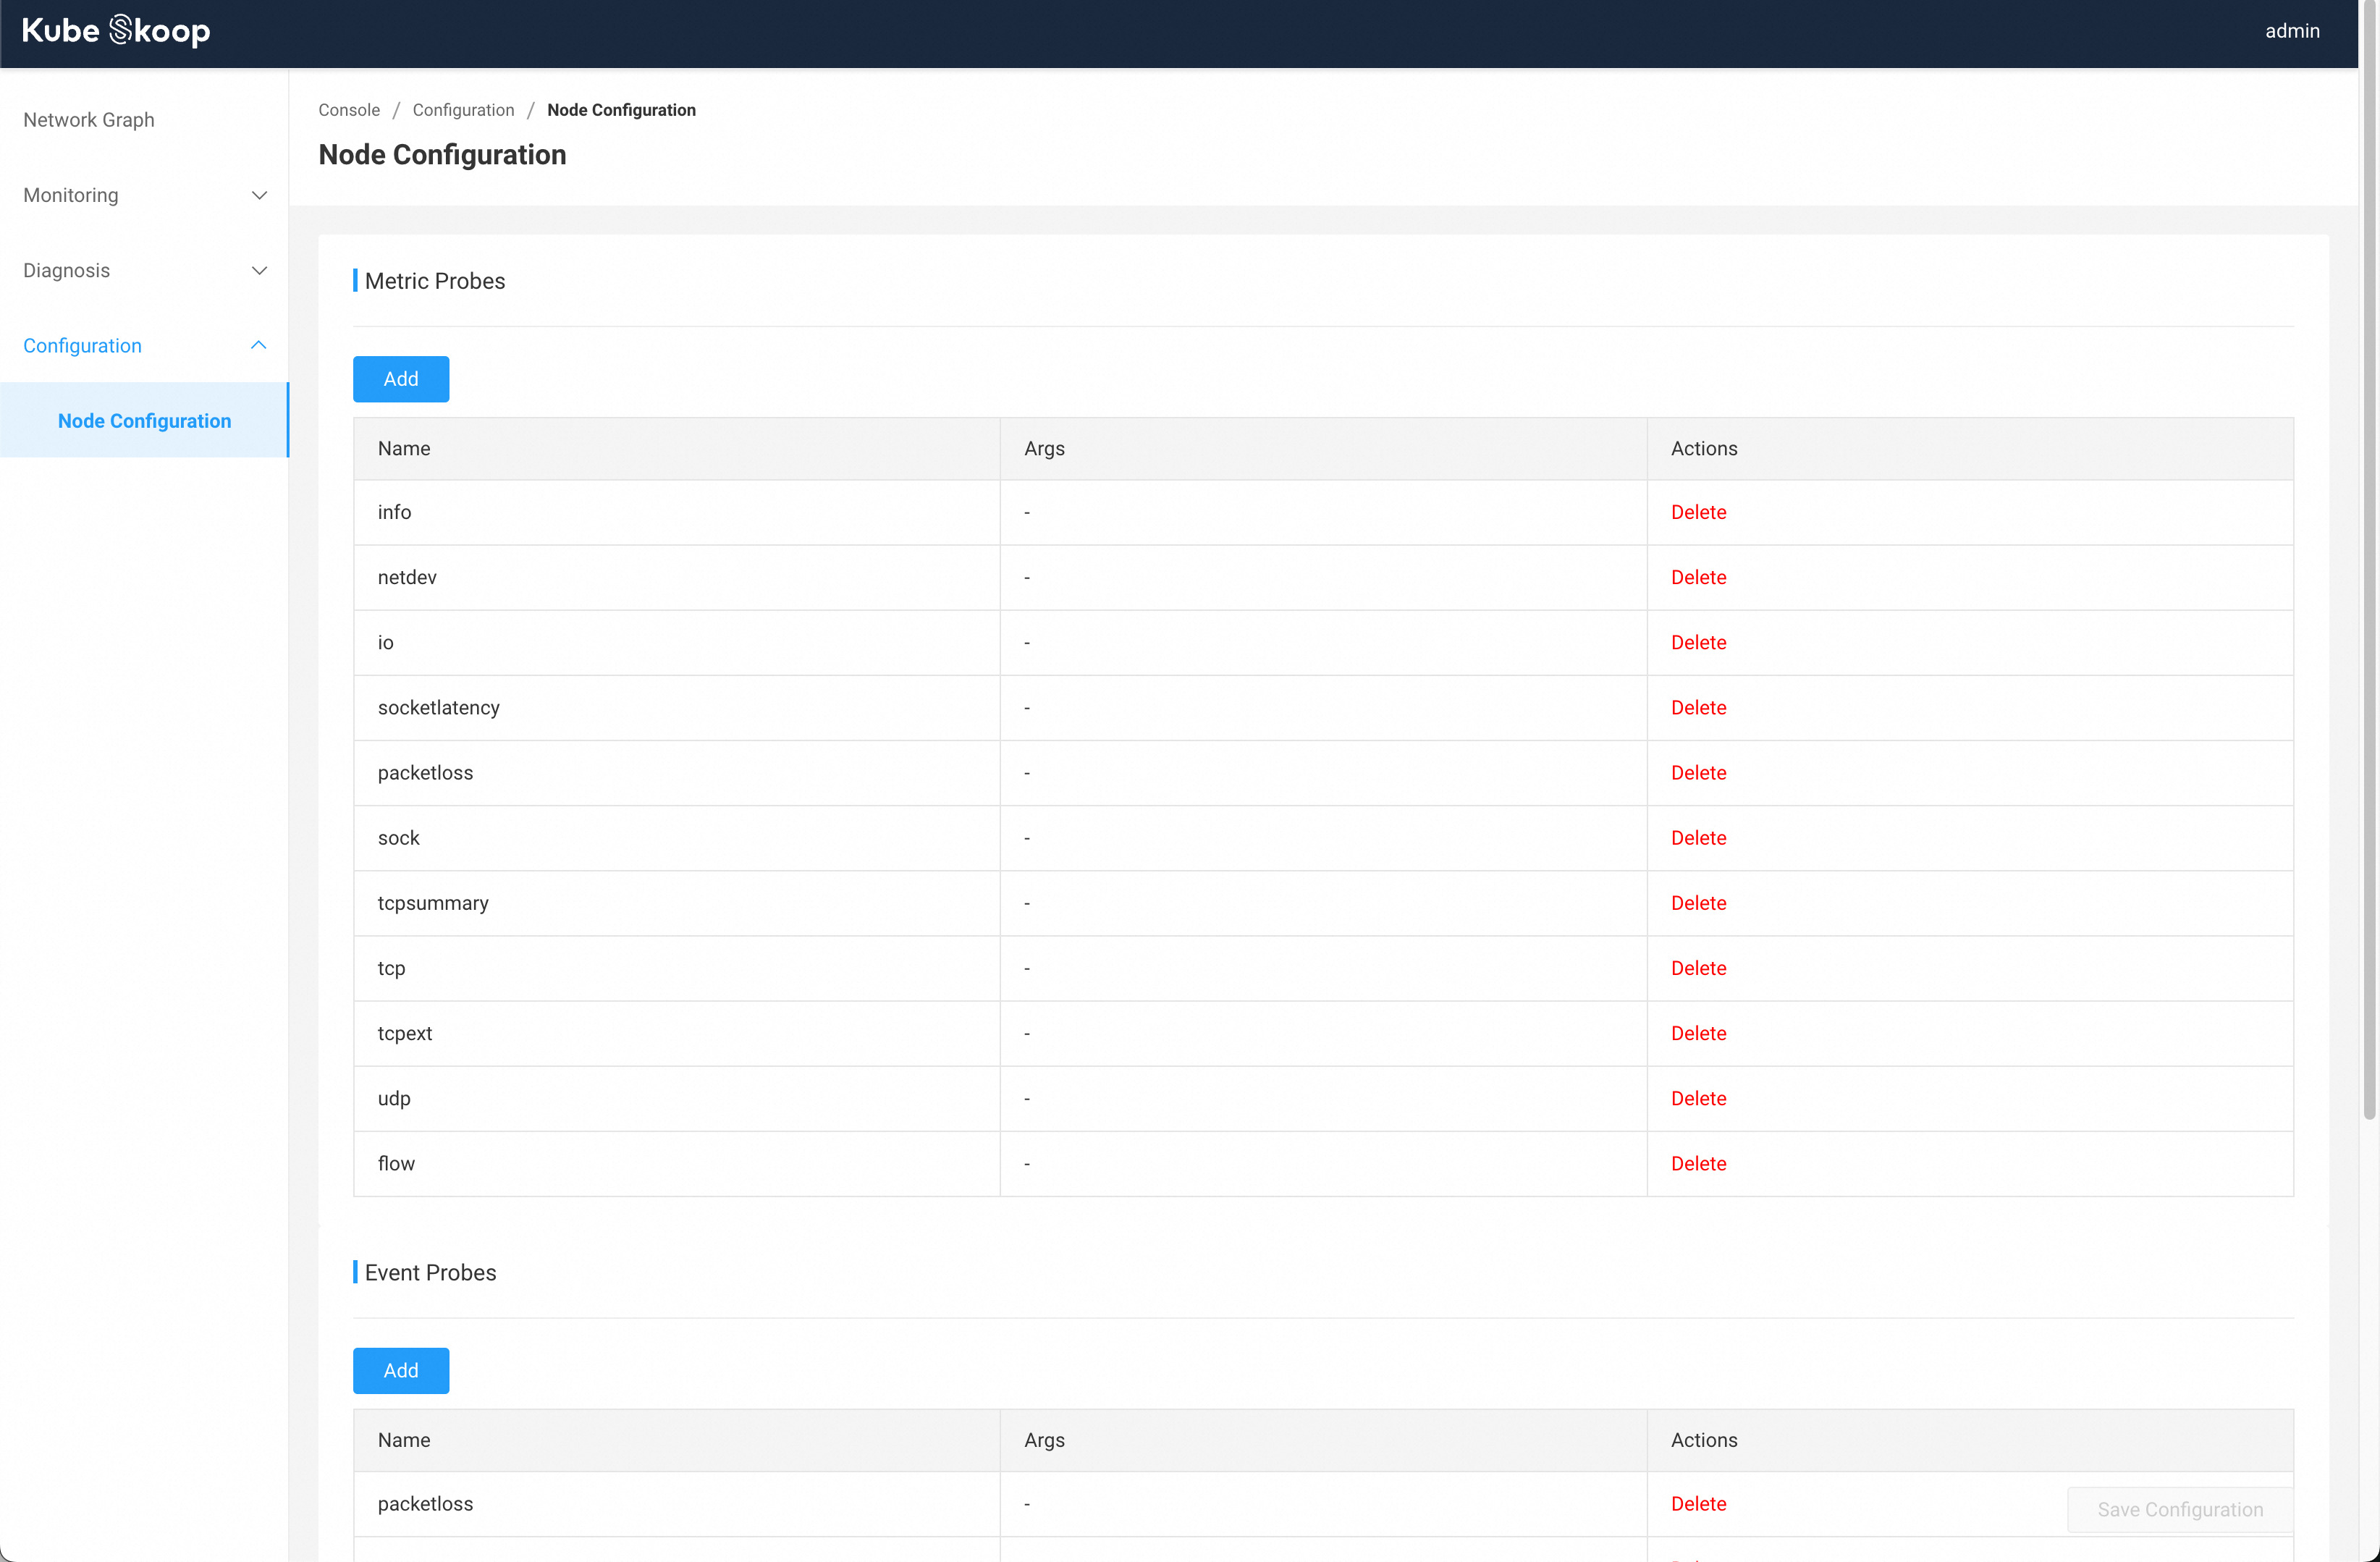
By clicking the Add or Delete, you can turn on or off the node's metrics/event probes, as well as configure the event collector from this page.
After making changes to the node configuration, you need to click the Save Configuration button at the bottom right corner of the page to make the changes take effect.