Web控制台
KubeSkoop provides a user-friendly web console that can be deployed directly into the cluster. It provides the following features:
- 网络问题诊断
- 网络连通性诊断
- 抓包
- 延迟探测
- 集群网络监控
- 网络抖动和性能大盘
- 网络抖动事件
- 网络链路图
监控集群网络
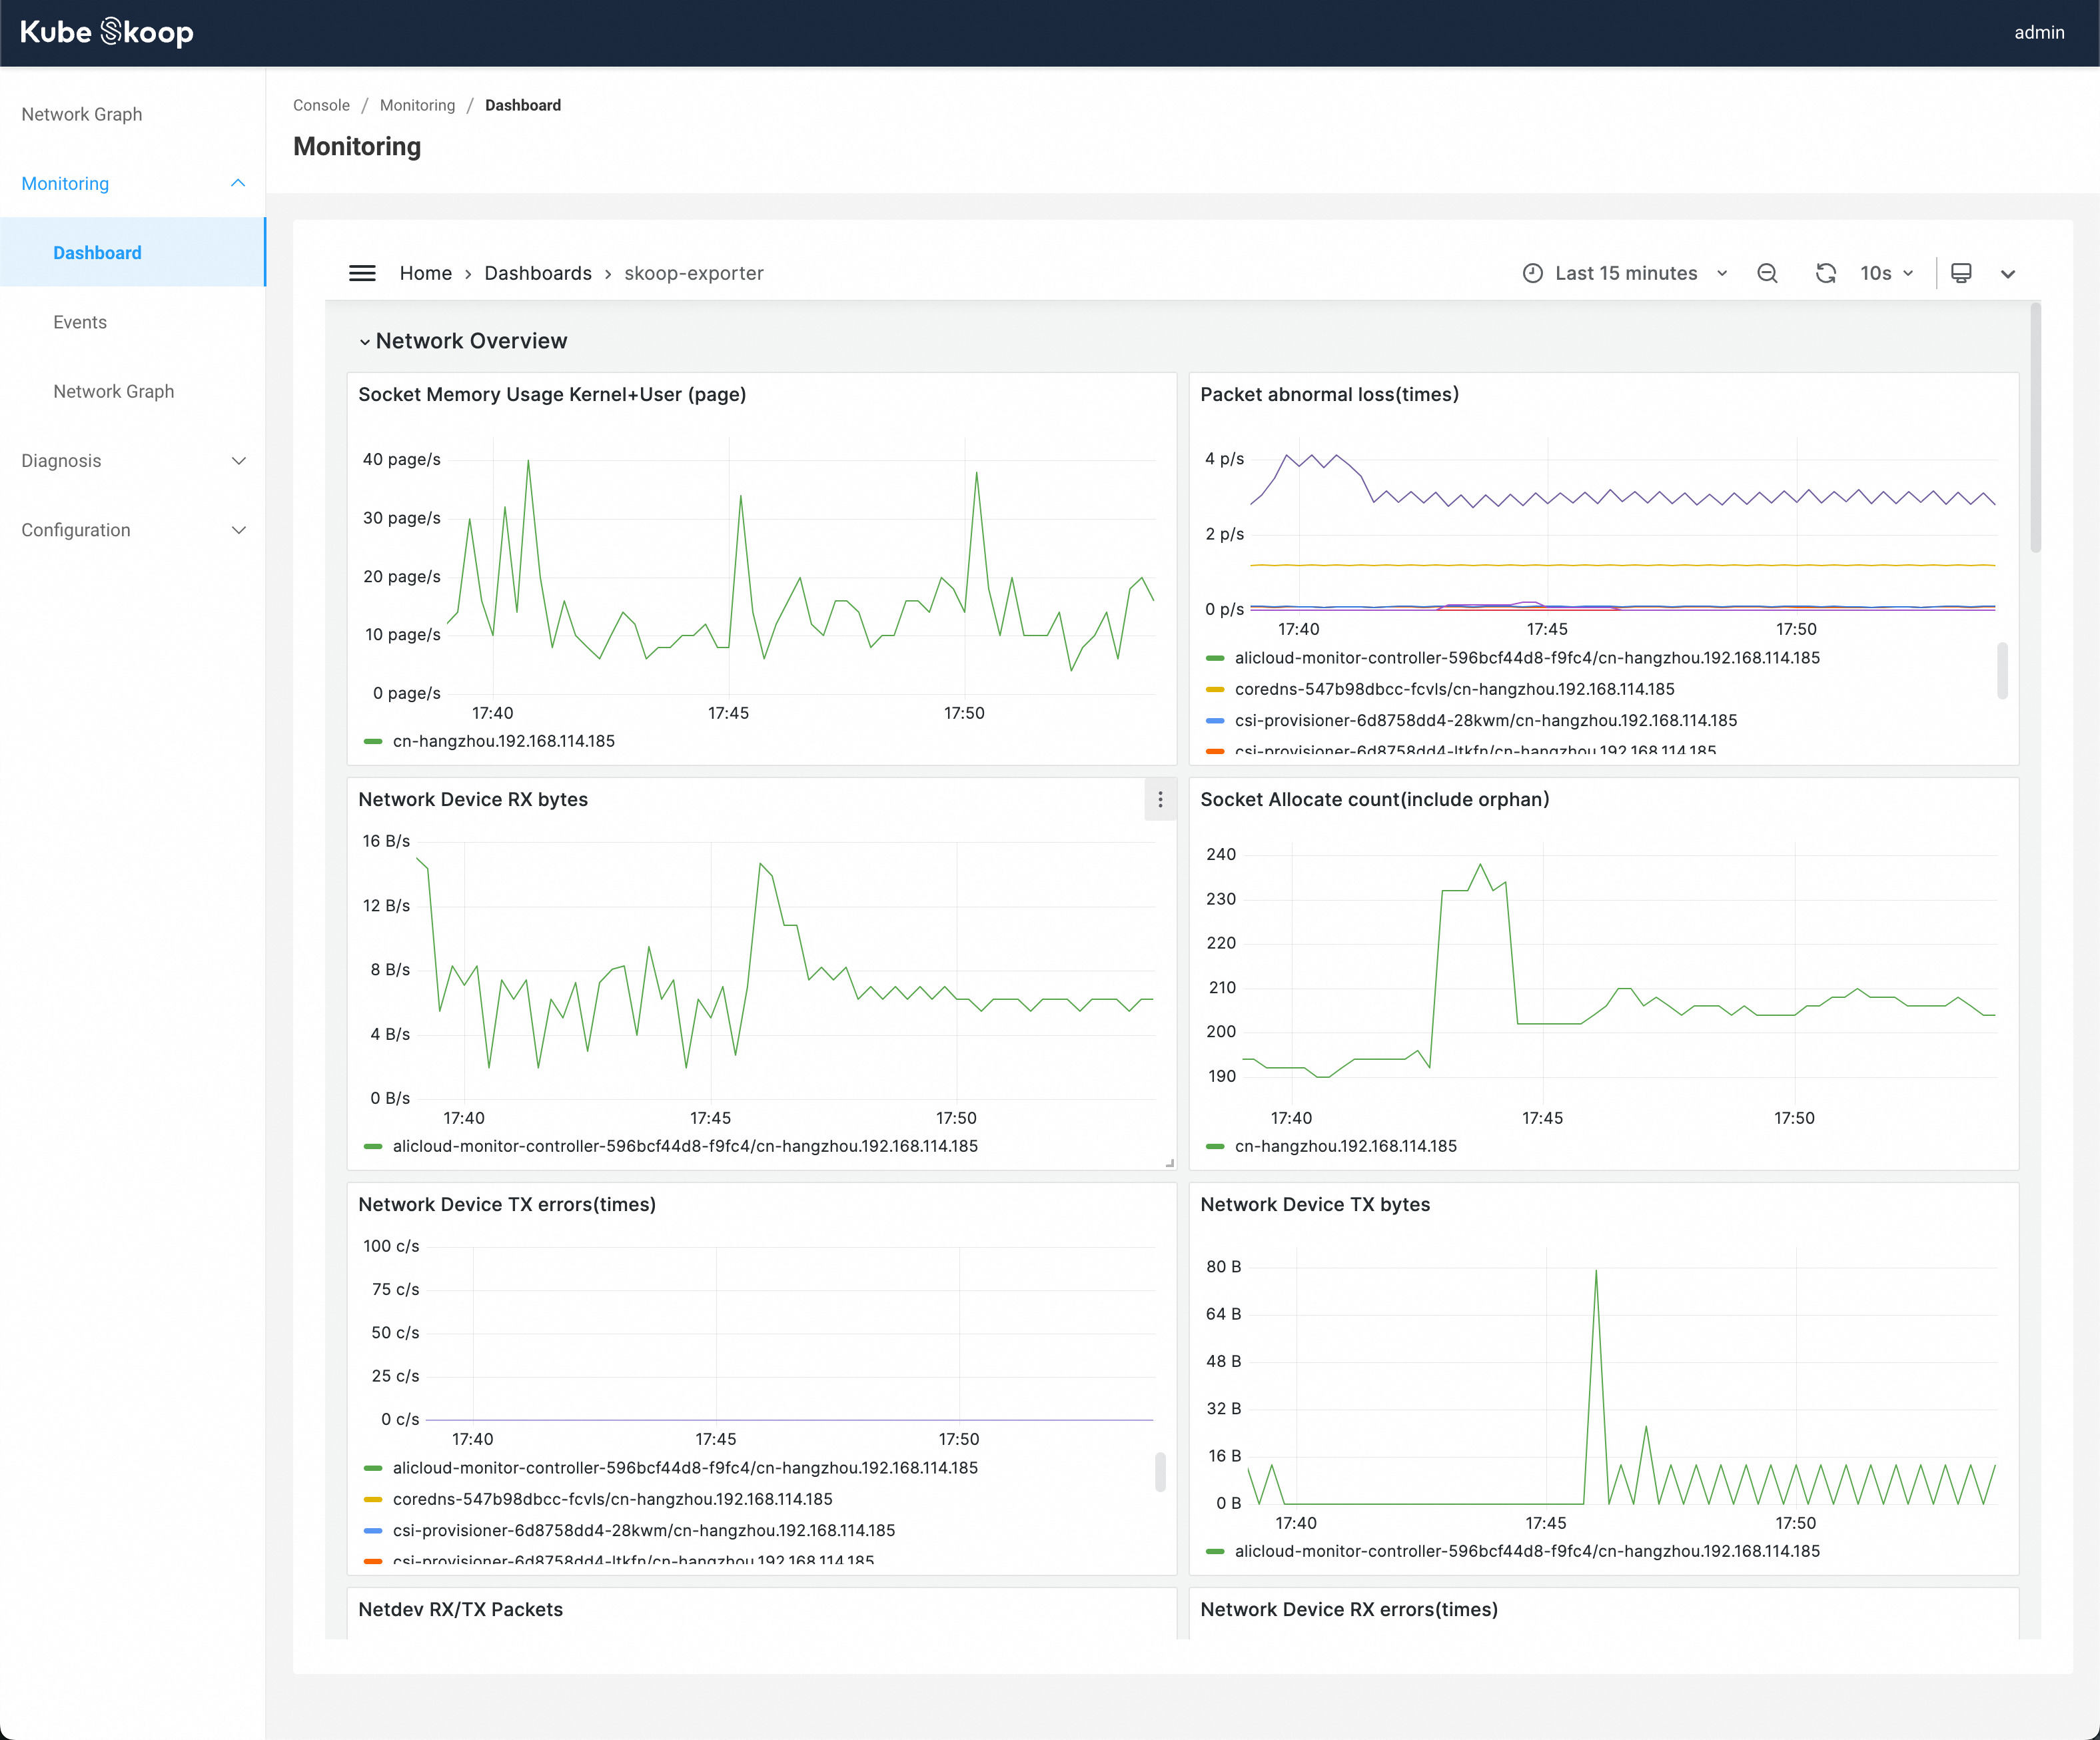
查看网络抖动和性能大盘
在Monitoring - Dashboard中,可以查看当前集群内网络大盘,从大盘中可查询对应性能问题时间点的各深度指标的水位情况。
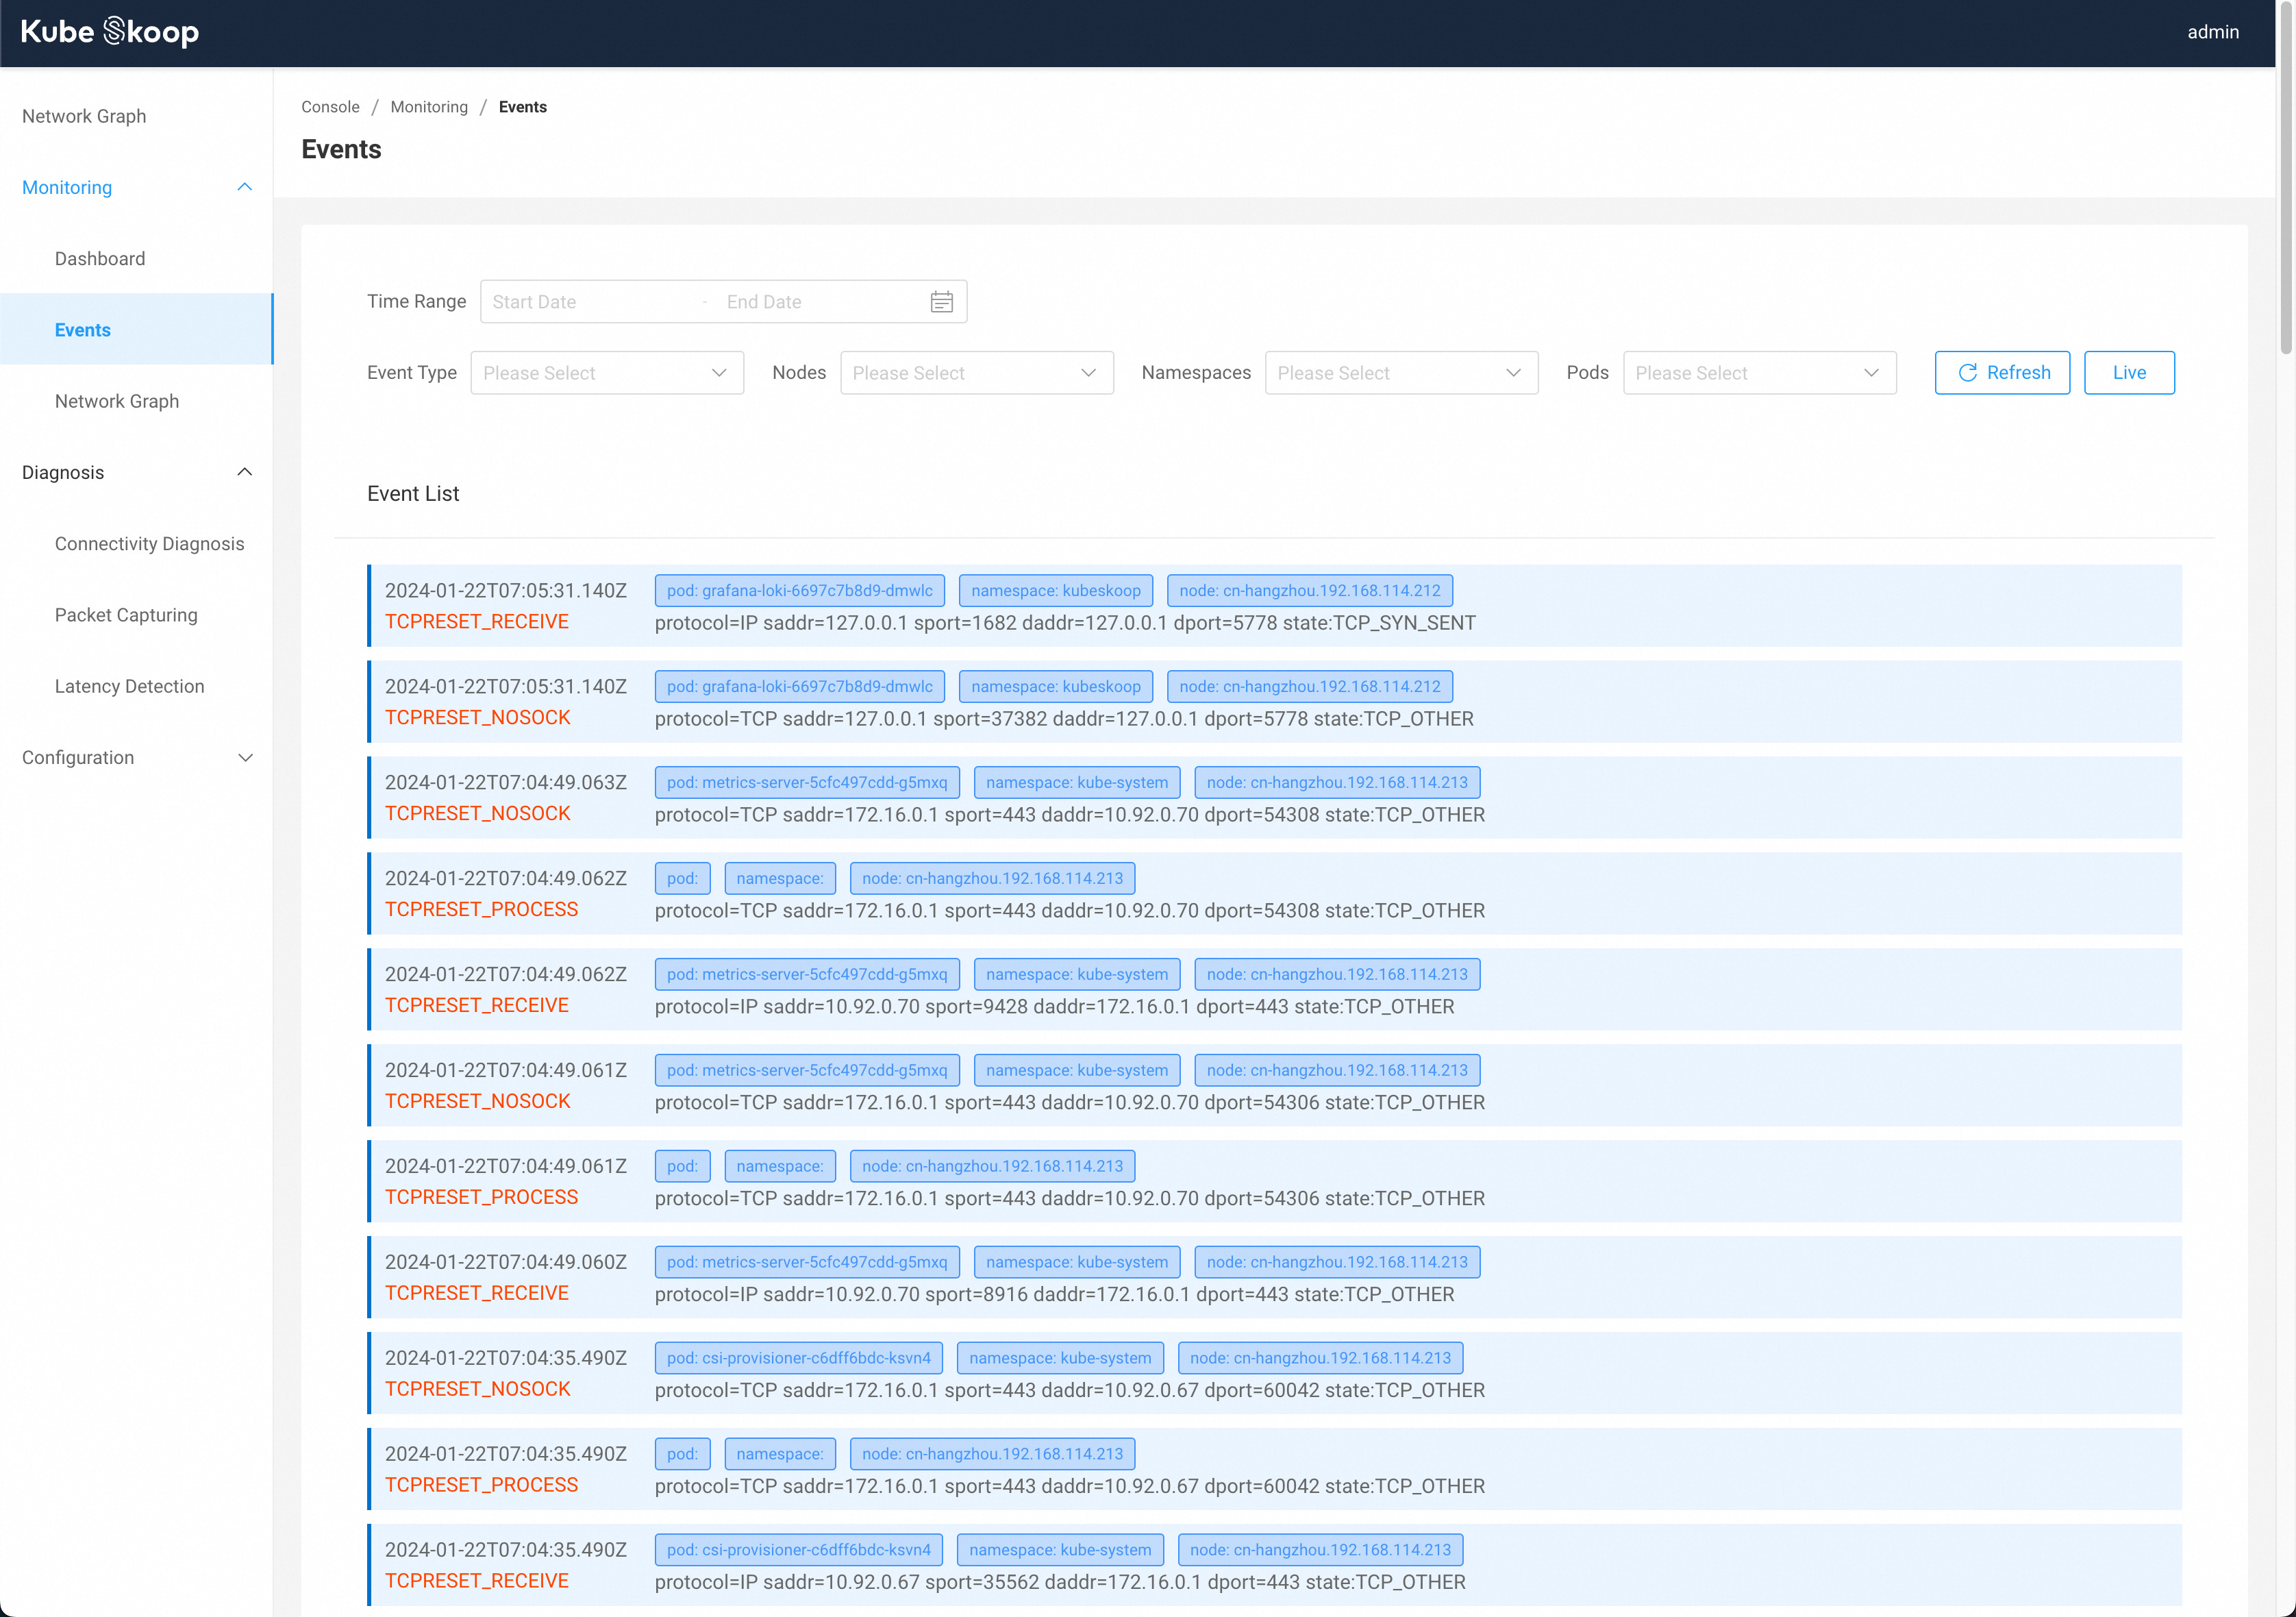
查看网络抖动事件
在Monitoring - Event下,可以看到当前时间点集群内产生的异常事件。你也可以手动选择需要的时间范围,或者根据事件类型、节点、事件产生的Pod命名空间/名称等信息进行筛选。
点击右上角的Live,可以实时根据当前筛选条件,实时监控集群内事件。
网络链路图
见网络链路图。
诊断网络问题
网络连通性诊断
见连通性诊断。
抓包
见抓包。
延迟探测
见延迟探测。
配置
节点配置
在Network - Configuration - Node Configuration中,可以对集群KubeSkoop Agent实例进行配置。
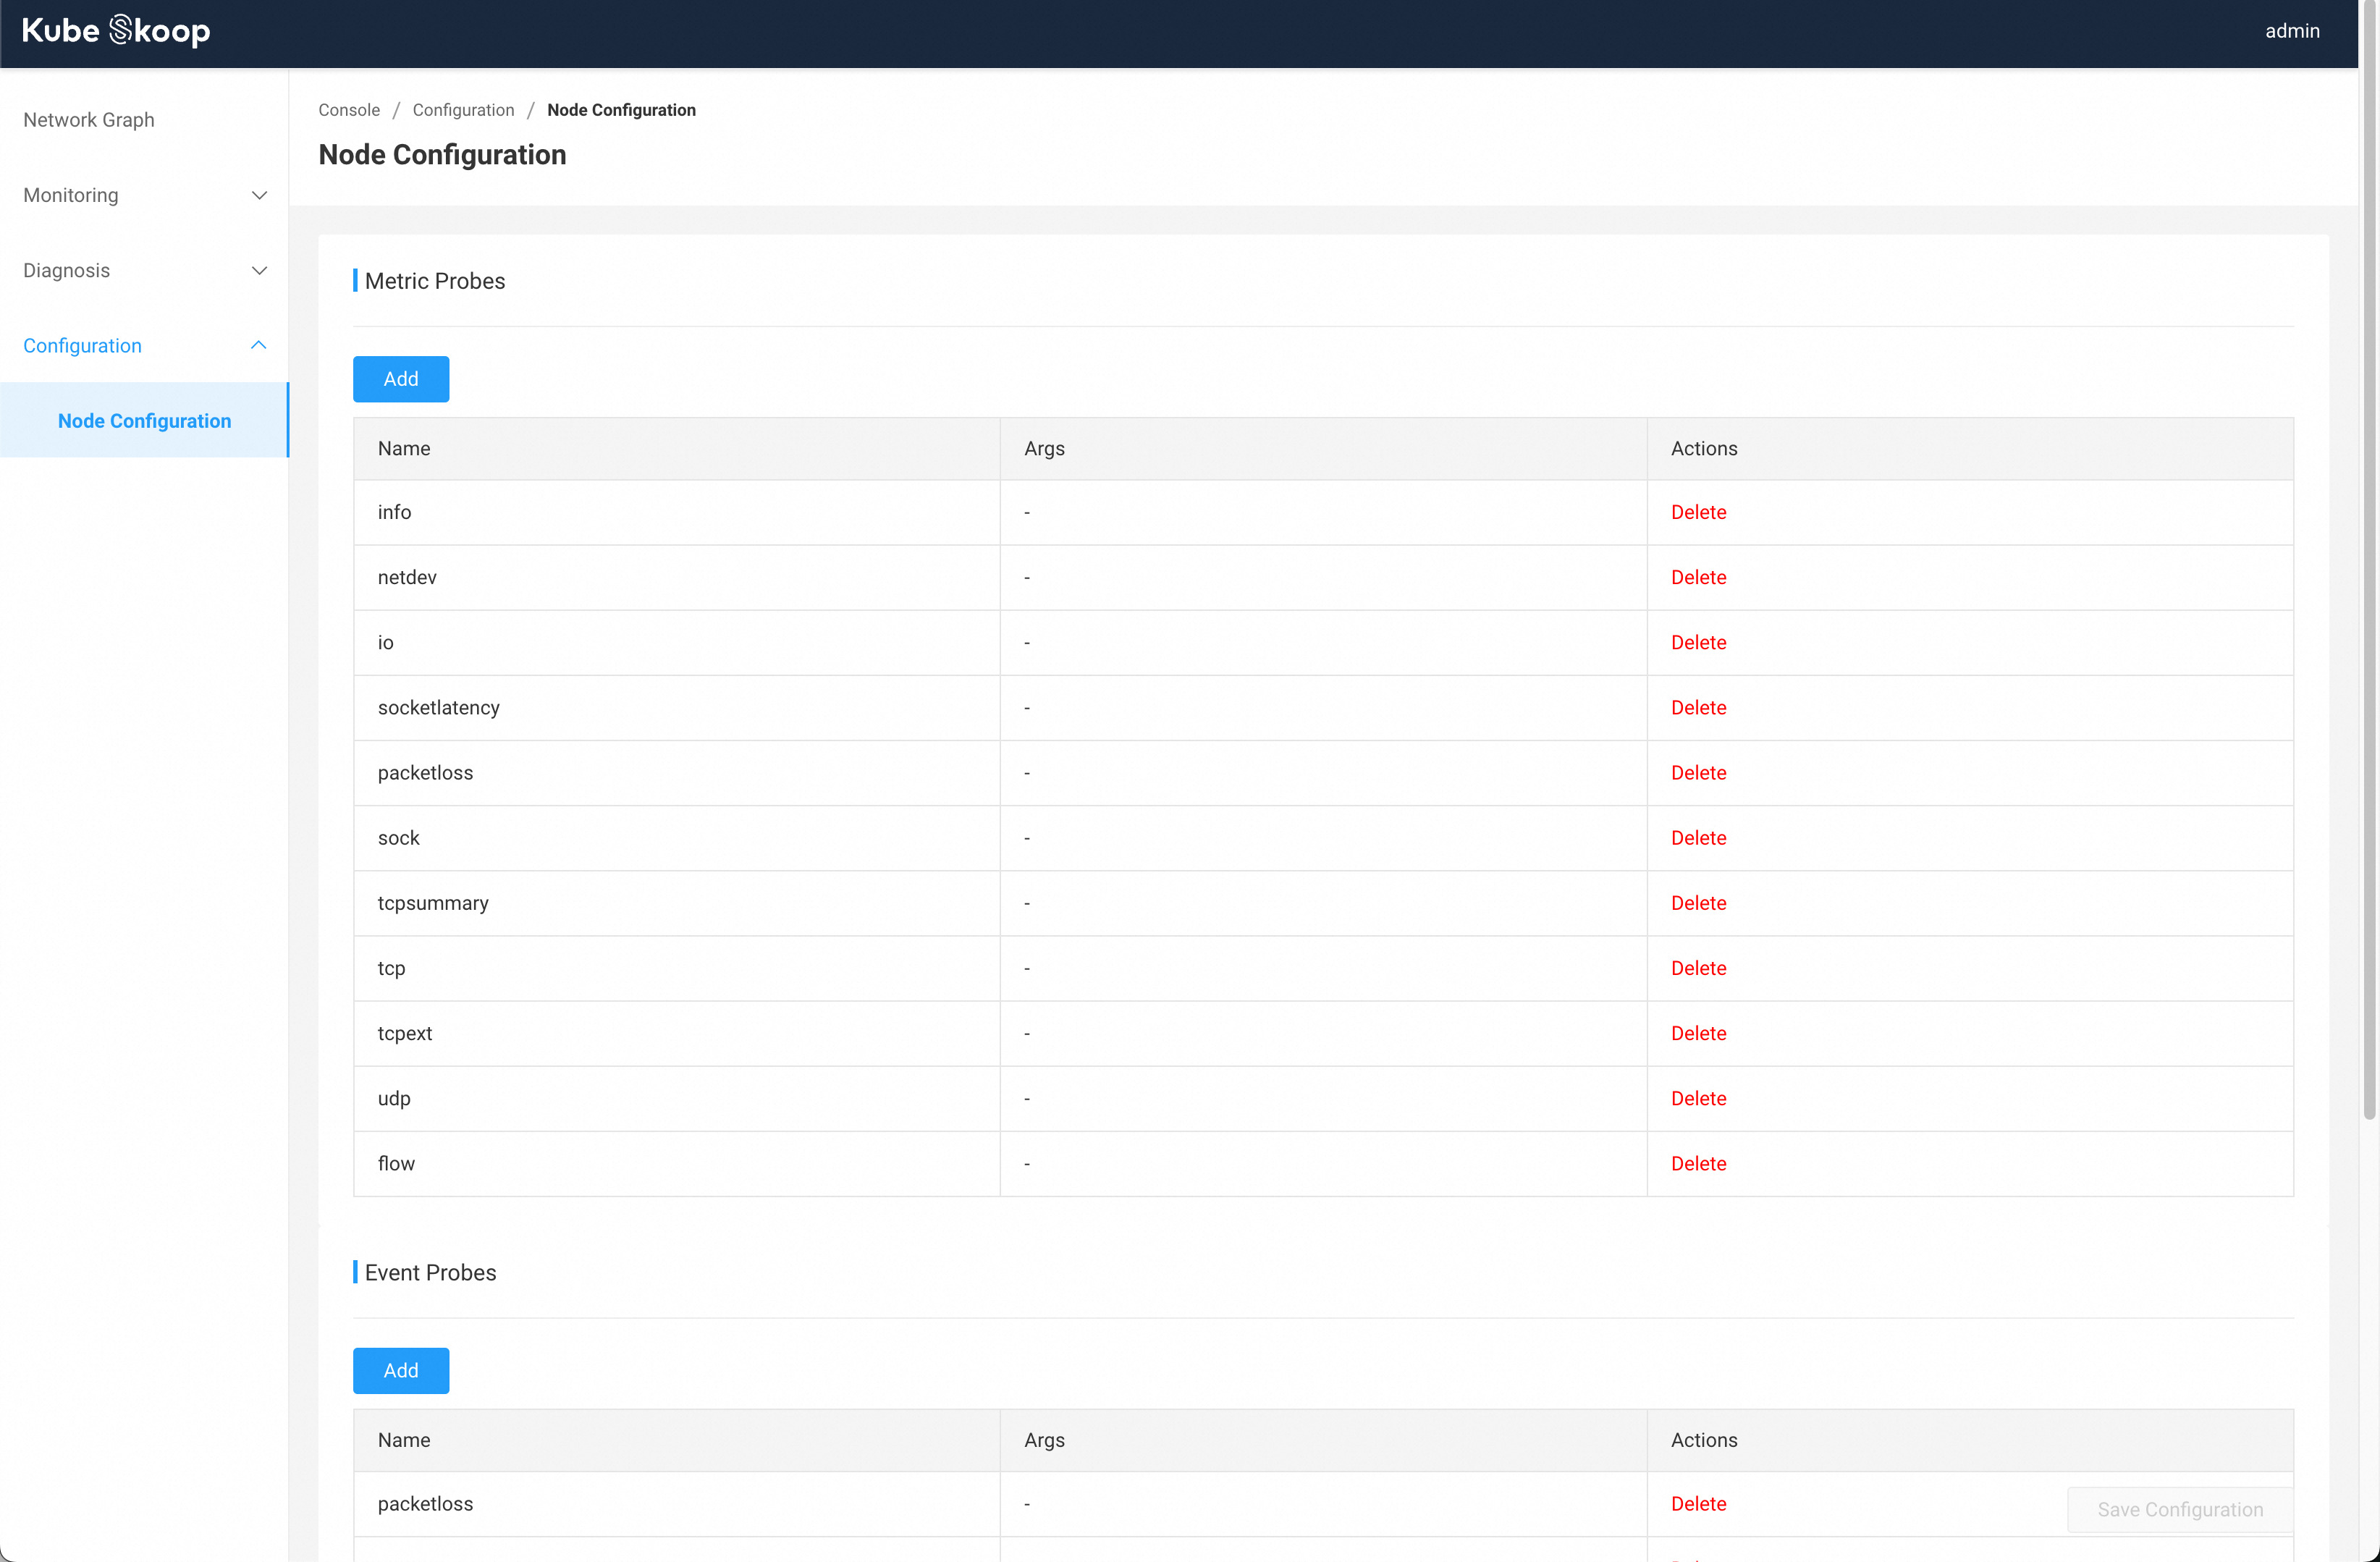
By clicking the Add or Delete, you can turn on or off the node's metrics/event probes, as well as configure the event collector from this page.
提示
在对节点配置修改完成后,需要点击页面右下角的Save Configuration按钮,使修改生效。