Visualization
Using Prometheus & Grafana for visualization of metrics
KubeSkoop provides a standard Prometheus format metric output service. You can quickly integrate KubeSkoop's metrics into an existing monitoring system. Please refer to the configuration for details.
If there is no ready-to-use monitoring service, please refer to the installation guide to set up a visual monitoring service.
- Refer to Prometheus Installation to complete the deployment and installation of Prometheus.
- Refer to Grafana Installation to complete the deployment and installation of Grafana.
Configuring KubeSkoop metrics
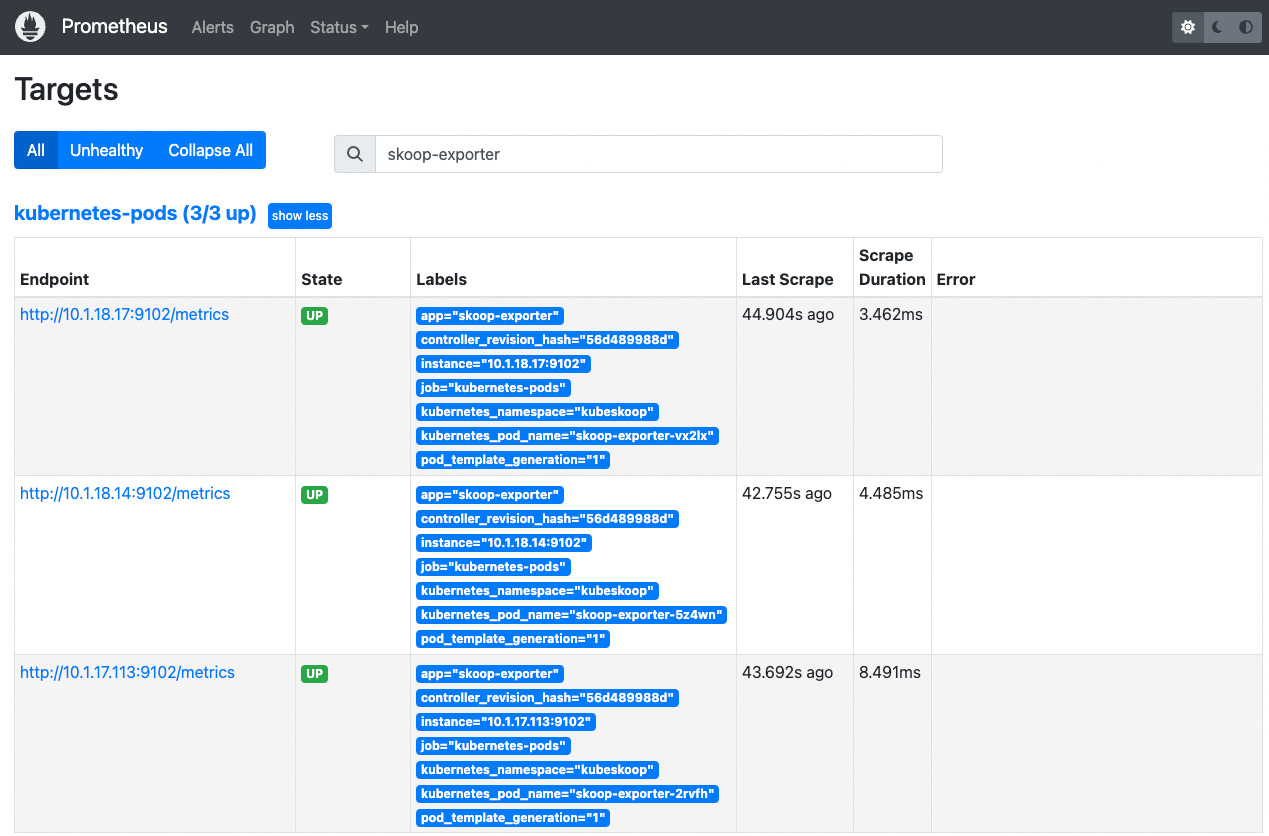
KubeSkoop supports the service discovering of Prometheus running in Kubernetes. After installing Prometheus, you can view the ready instances by entering skoop-exporter in the search bar on the Status->Targets page, for example:
After the KubeSkoop instance is successfully scraped by Prometheus, you can complete the visualization of metrics through the following steps:
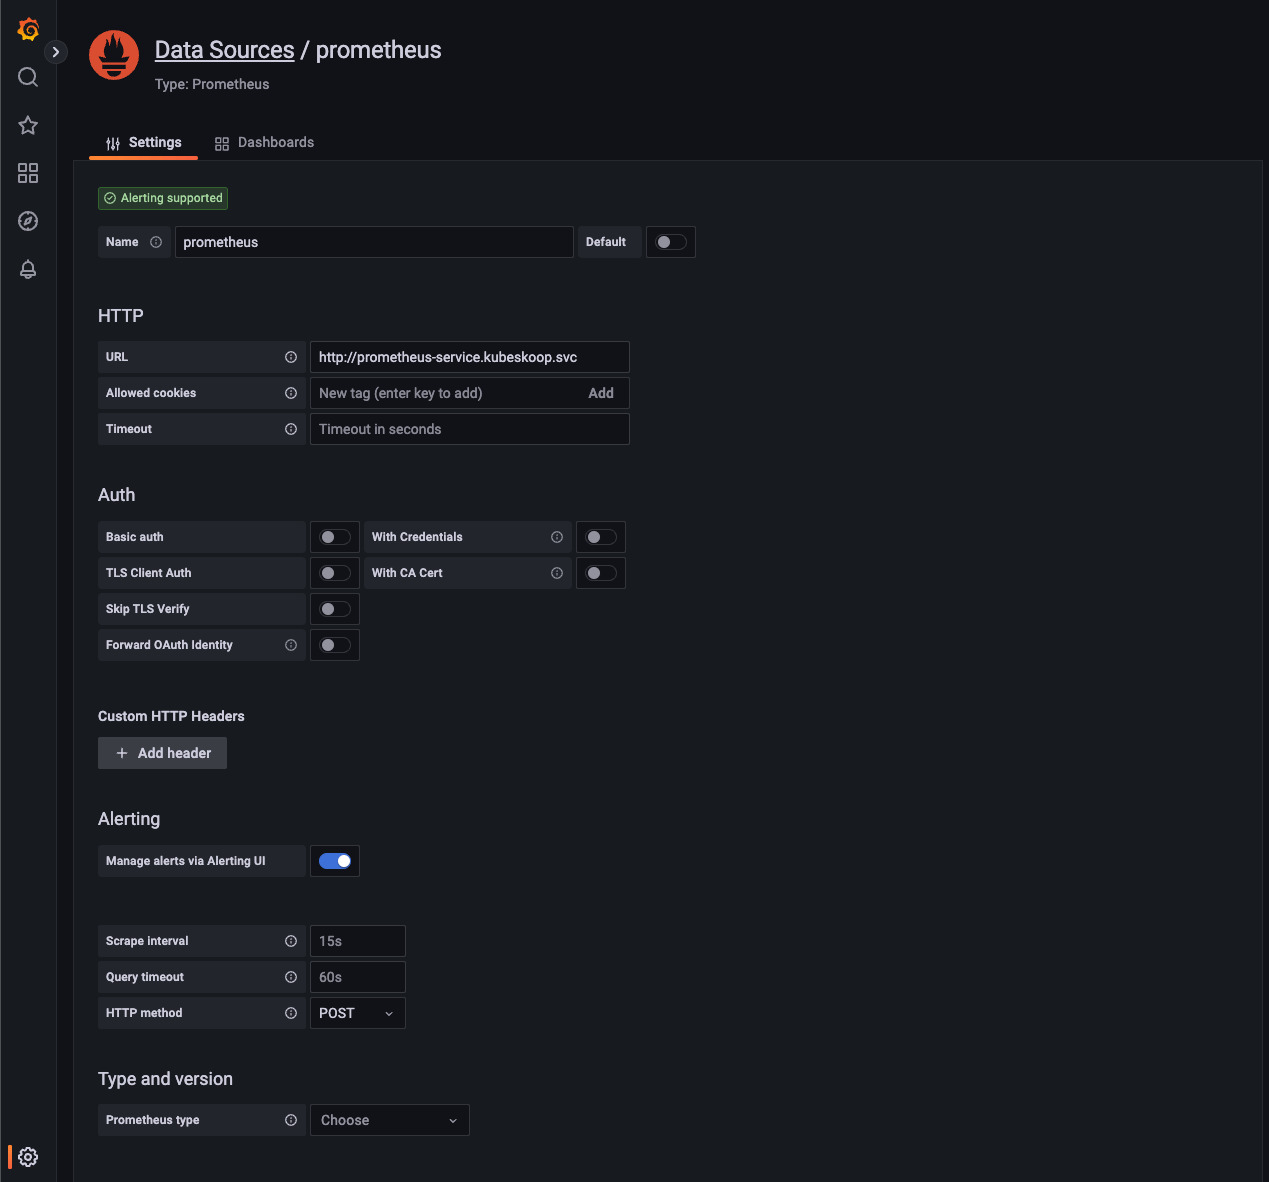
- Enter the Grafana console, click Configuration->Data sources->Add data source, select Prometheus, and add the address of the prepared Prometheus instance to the data source subscription of Grafana
- Create a new dashboard or select to create a new panel in an existing dashboard. In the panel configuration, select the data source configured in 1, enter inspector in the Metric browser, and you can see the associated KubeSkoop metrics. Select the desired information from it, for example, inspector_pod_netdevrxbytes. After inputting this, you can see the obtained data in the panel.
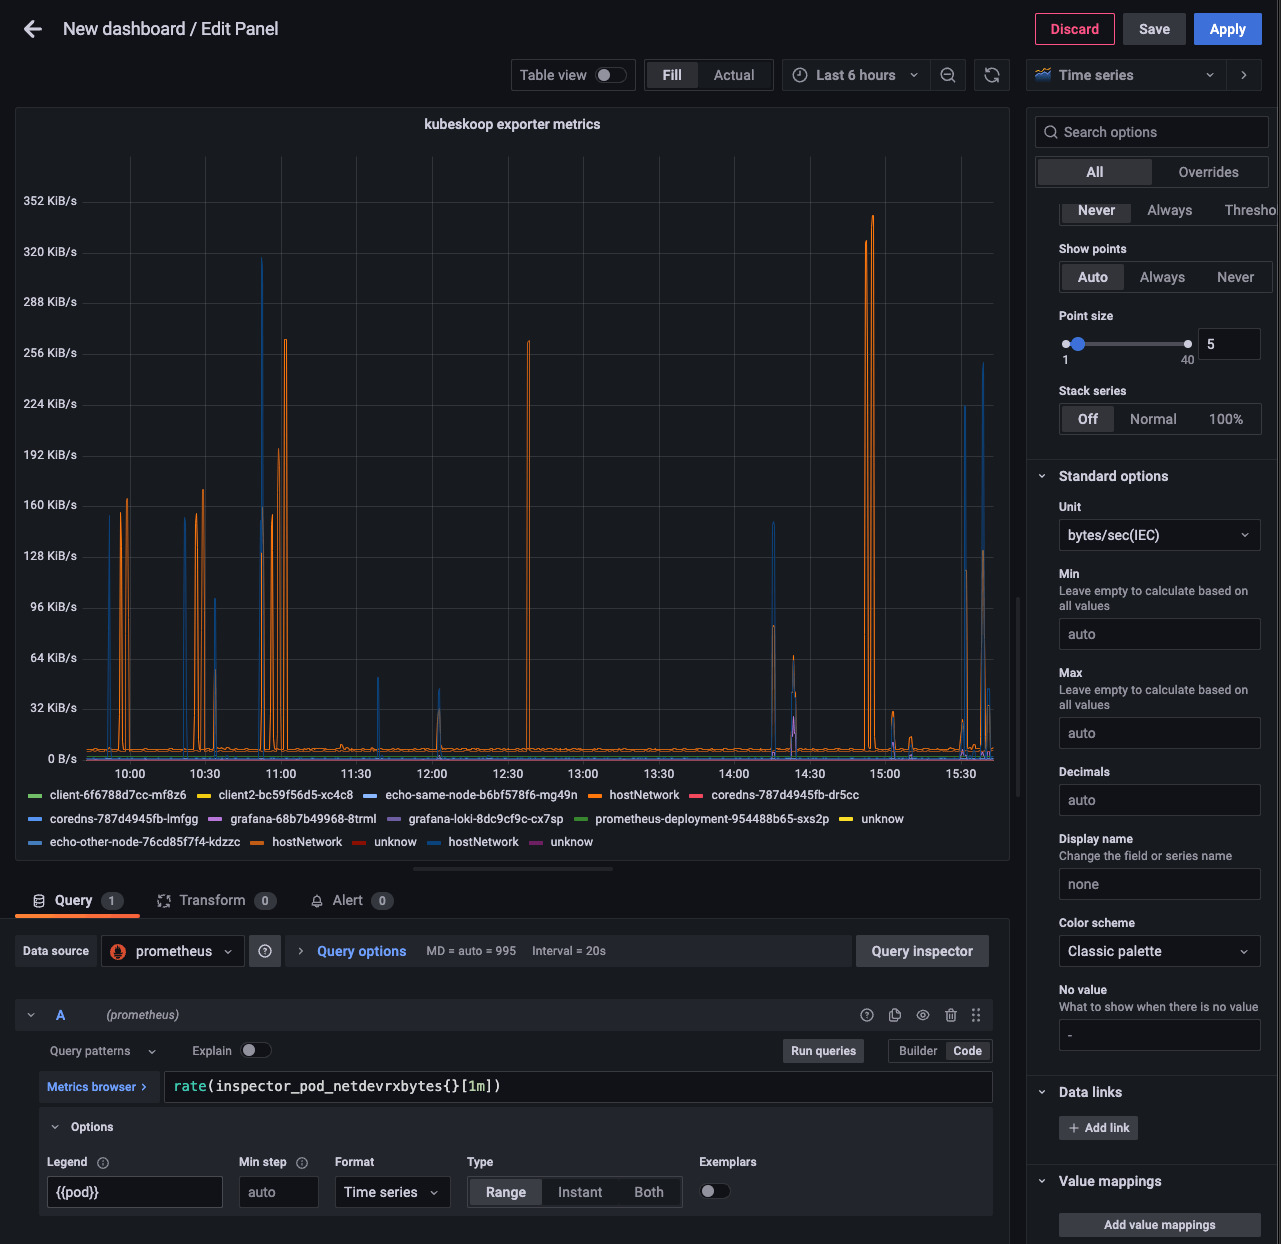
- In the visualization of metrics, you can set the legend and unit information of the metrics as needed. The legend supports configuring information such as the Pod's namespace, IP, and label. These supported legends can be configured in the panel's Legend.
Import the pre-defined default dashboard
KubeSkoop provides a default Grafana dashboard configuration file that can follow version updates:
curl https://raw.githubusercontent.com/alibaba/kubeskoop/main/deploy/resource/kubeskoop-exporter-dashboard.json -o dashboard.json
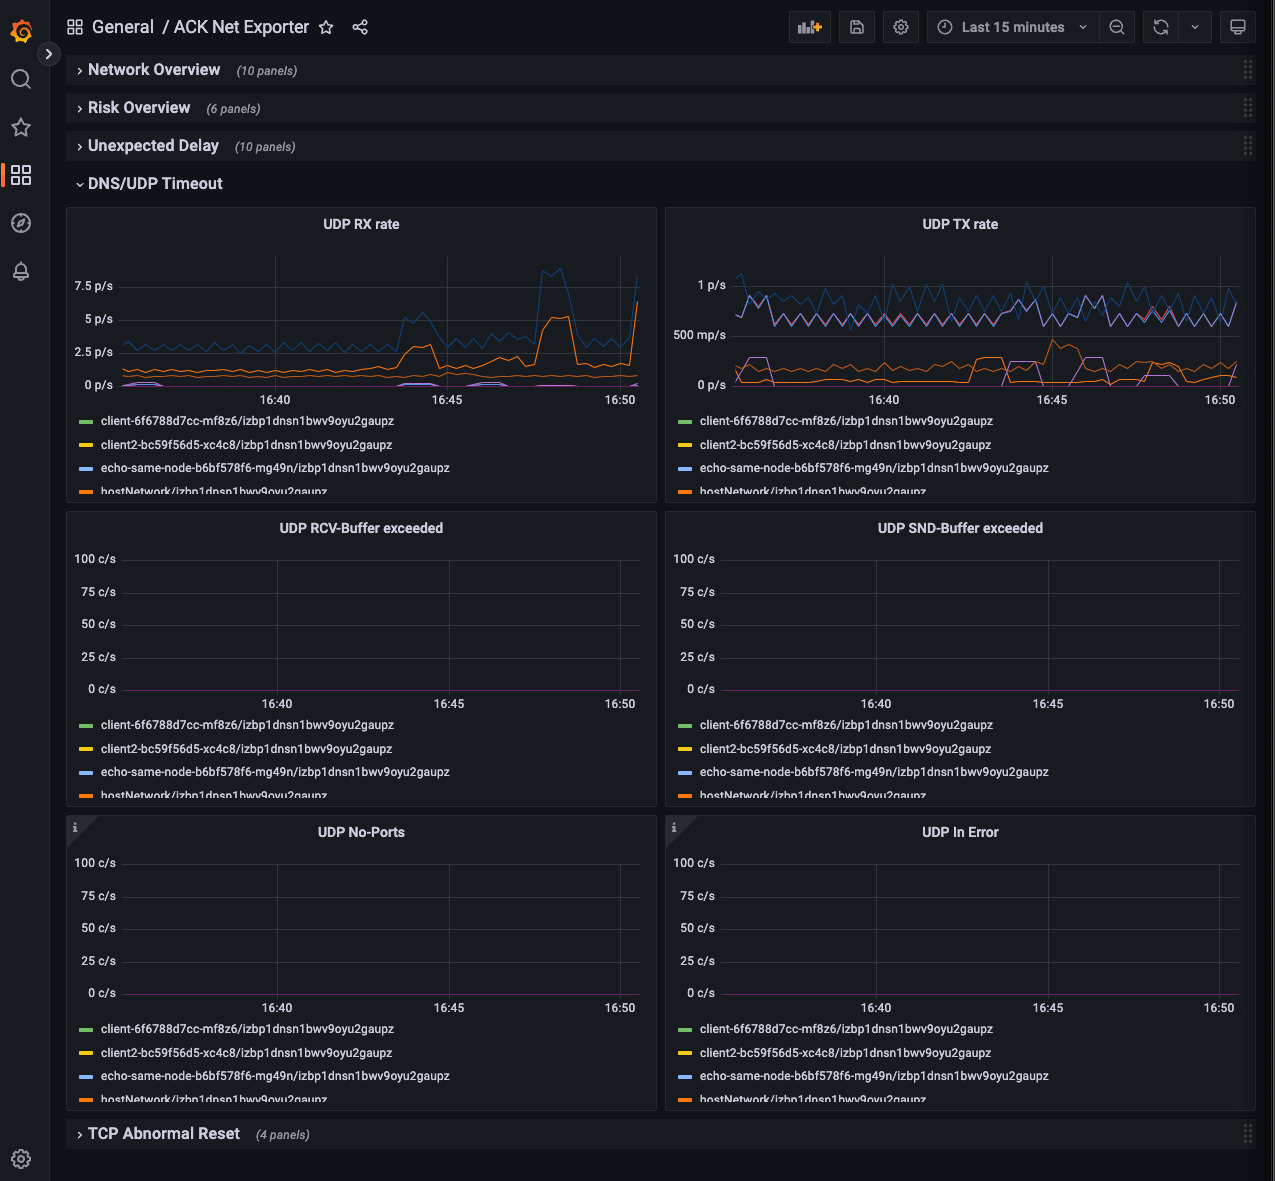
After logging in to the Grafana console, click Dashboards->Import->Upload JSON file, select the saved file for upload, select Take Prometheus as data source, and click Import to import it. You can then view the default dashboard. By selecting different panel groups, you can view monitoring metrics of different categories.
Use Grafana & Loki to view visualized network events
Installation
Follow the official documentation to install Grafana Loki for different scenarios Grafana Loki Installation。
After installation, you can check the availability of Grafana Loki using the following methods:
curl http://[Endpoint of Grafana Loki]:3100/ready
Configure KubeSkoop event stream
Grafana dashboard
You can use Grafana to visualize the events which KubeSkoop pushed to Grafana Loki. Follow these steps to achieve visualization:
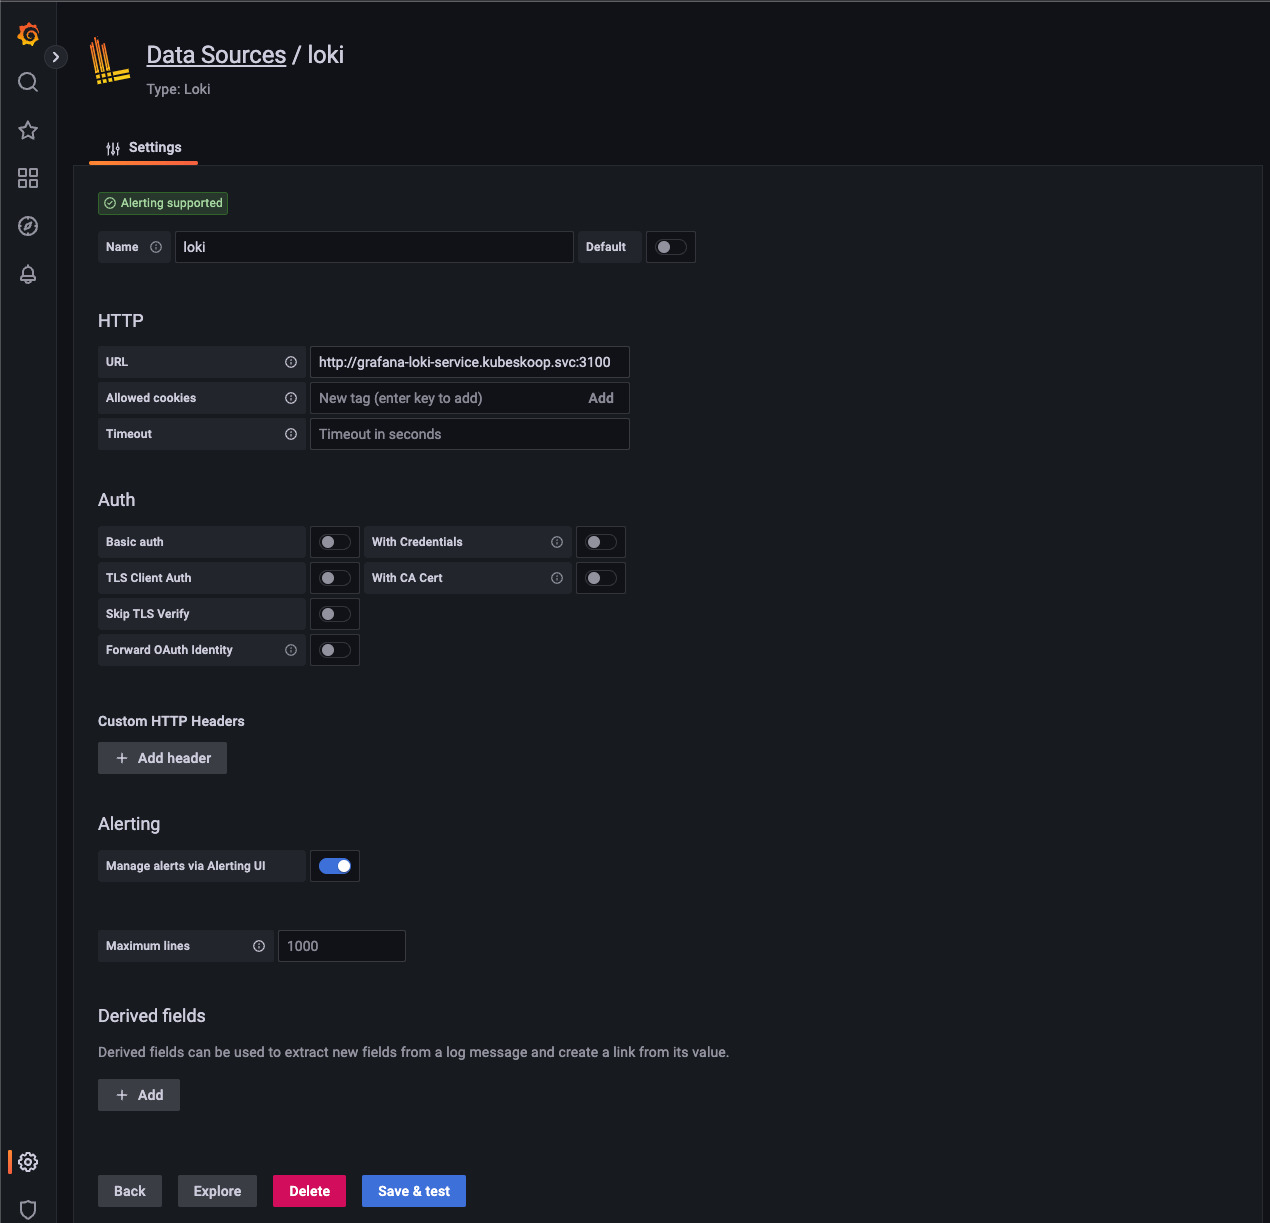
- After clicking Configuration->Data sources->Add data source, select Loki, and add the address of the Grafana Loki service to the data source subscription of Grafana. This can be an IP address or domain name with a default port of 3100.
- Create a new dashboard or select a new panel in an existing dashboard. In the panel configuration, select the data source configured in step 1 as the data source, and filter the required event information in the Label browser.
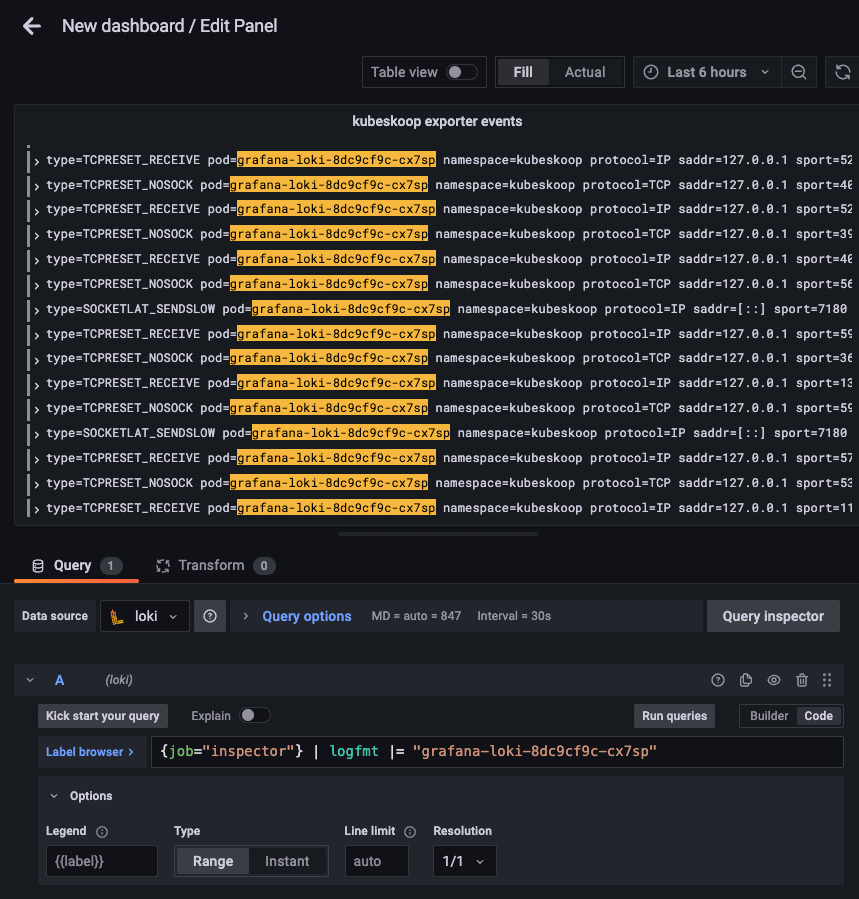
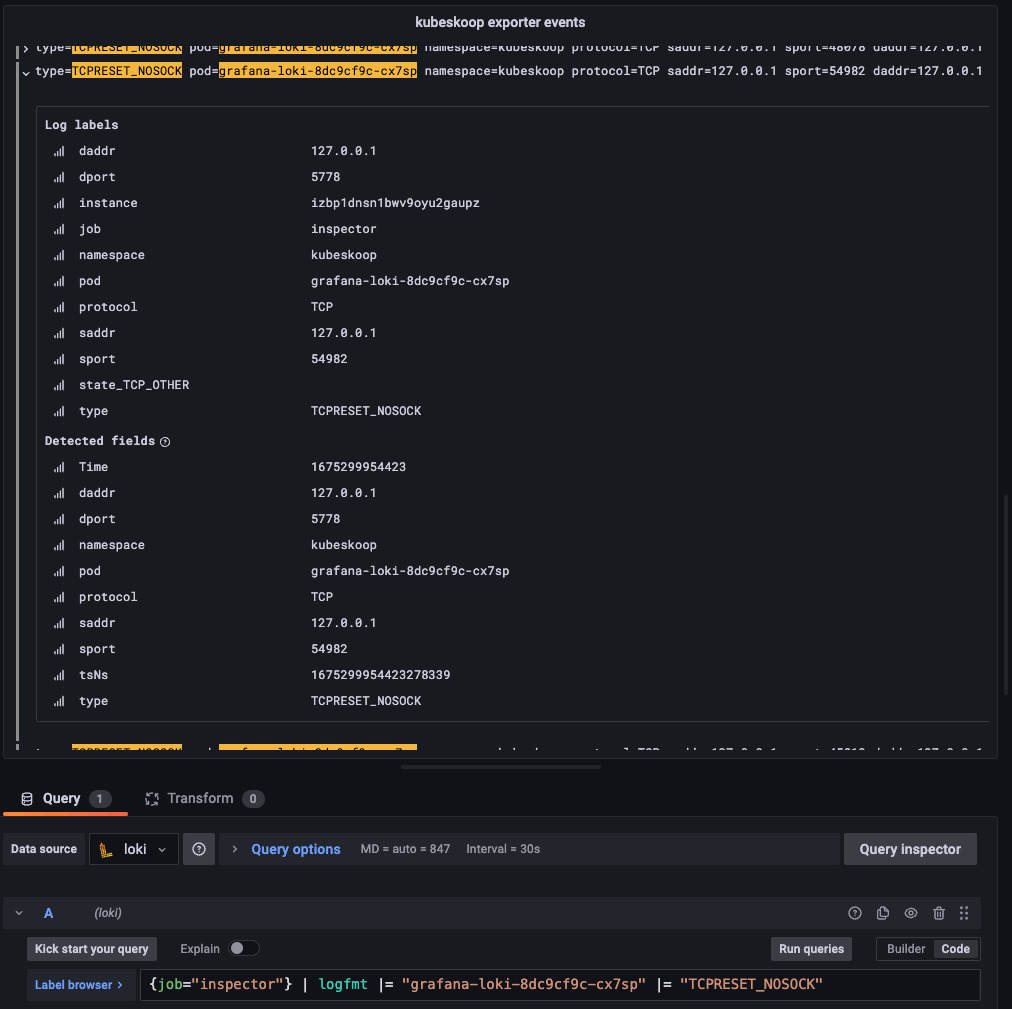
- In the event panel, you can query specific events through LogQL. After clicking on the event, you can view detailed on-site information.