Intro
Overview
KubeSkoop provides the following features:
- Pod-level network monitoring, including traffic, application layer connection information, socket memory allocation status, and more.
- Metrics monitoring for network abnormal states at the Pod level, such as the number of times a Pod's process waits for more than 100ms to read or write to a socket, the number of times a Pod issues TCP RST packets, and so on.
- At the Pod level, provide on-site observation of network abnormal events and detailed information on the occurrence of events, such as the kernel network soft interrupt scheduling waiting too long, UDP overflow caused by socket memory shortage, and more.
The main differences from common Kubernetes monitoring and observability tools are as follows:
| Features | Prometheus Node exporter | cAdvisor/Metric API | KubeSkoop exporter |
|---|---|---|---|
| By Pod differentiation | No | Yes | Yes |
| Network status monitoring | Yes | No | Yes |
| On-site capture of abnormal events | No | No | Yes |
| Advanced kernel network information | No | Yes | Yes |
Introduction
Architecture
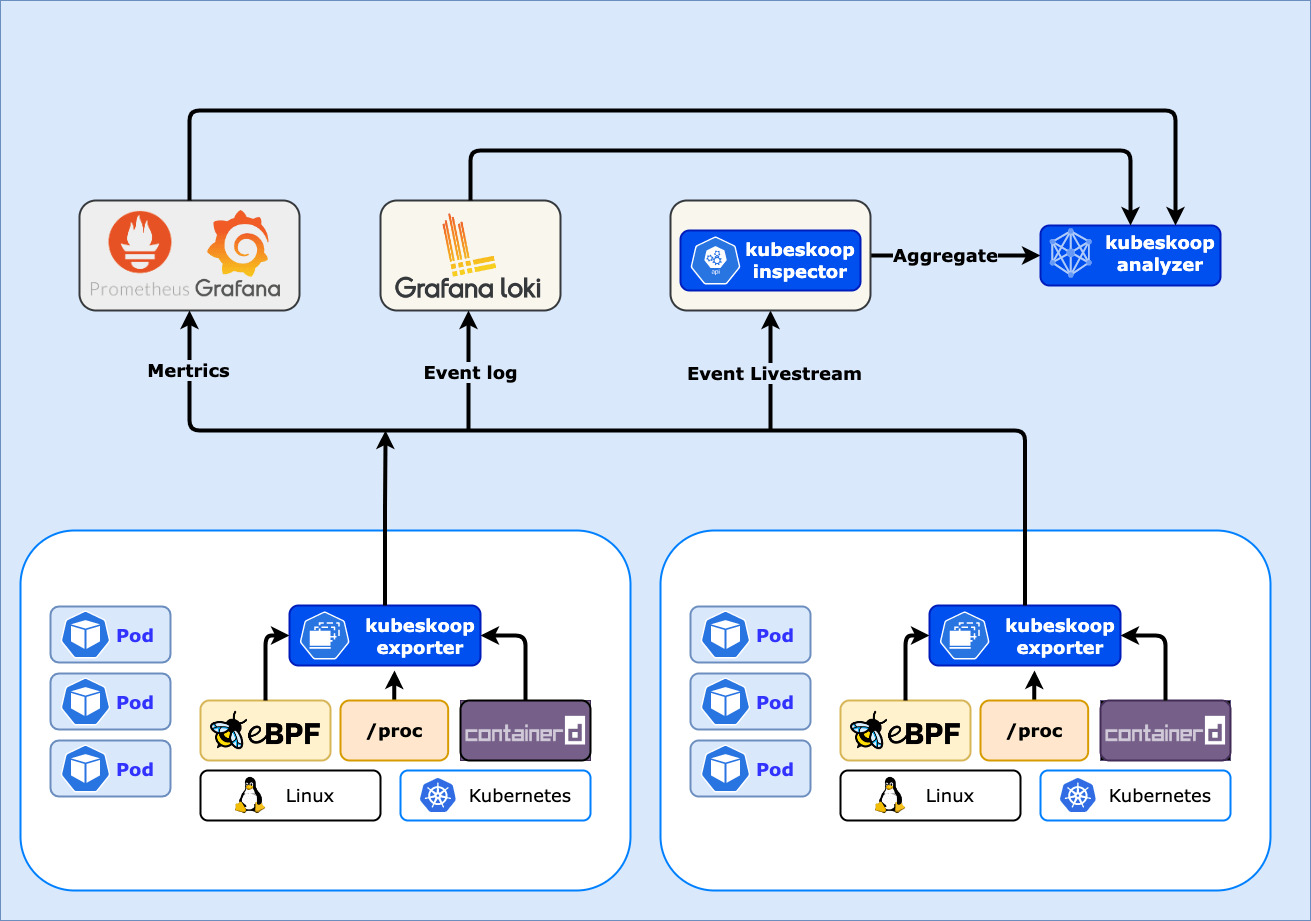
Information gathering
KubeSkoop exporter provides adaptation for Kubernetes network monitoring function. On the nodes, KubeSkoop exporter collects and categorizes a large amount of network-related data. The core principle behind these functions includes:
- Obtaining the network isolation status within the node and its association with Pods through the CRI interface and Linux /proc/.
- Obtaining network monitoring information through Linux /proc/, Linux netlink, and eBPF.
- Obtaining the contextual state of the operating system kernel during network anomaly events through eBPF.
Aggregated analysis
- Scraping monitoring information through Prometheus and visualizing it using Grafana.
- Configuring Grafana Loki to receive event push from KubeSkoop exporter and visualizing it using Grafana.
- Using the KubeSkoop inspector command-line tool to observe monitoring information.
Regarding how to visualize monitoring data, please refer to visualization
Metrics
KubeSkoop exporter provides Pod-level metric information to reflect environmental changes during instance operation, and exposes the metrics via Prometheus.
Events
KubeSkoop exporter provides network-related abnormal events occurring on the nodes. Based on our experience in handling network issues in the long-term, we have summarized several common network troubleshooting problems. They often interfere with normal business operations in the cluster in an unpredictable and occasional manner, lacking effective localization methods. Some of them are as follows:
- Connection failure, response timeout, and other issues caused by discarded network packets.
- Occasional performance issues caused by longer processing time for network data.
- Task abnormality issues caused by TCP, conntrack, and other stateful abnormalities.
For network issues that are difficult to quickly reproduce and obtain on-site, KubeSkoop exporter provides eBPF-based operating system kernel context observation capabilities to capture the real-time state of the operating system at the scene of the problem and output it in the form of event logs.
In the information of the event log, relevant information of the event scene can be viewed. Taking the tcp_reset probe as an example, when a Pod receives a normal message on a certain port, KubeSkoop exporter will capture the following event information:
type=TCPRESET_NOSOCK pod=storage-monitor-5775dfdc77-fj767 namespace=kube-system protocol=TCP saddr=100.103.42.233 sport=443 daddr=10.1.17.188 dport=33488
For events that require effective operating system kernel stack information, additional protocol stack information of the operating system kernel can be obtained by configuring the switch, which will increase certain costs and obtain more accurate phenomena, for example:
type=PACKETLOSS pod=hostNetwork namespace=hostNetwork protocol=TCP saddr=10.1.17.172 sport=6443 daddr=10.1.17.176 dport=43018 stacktrace:skb_release_data+0xA3 __kfree_skb+0xE tcp_recvmsg+0x61D inet_recvmsg+0x58 sock_read_iter+0x92 new_sync_read+0xE8 vfs_read+0x89 ksys_read+0x5A
For list for currently supported probes, metrics and events, please refer to Probes, Metrics and Events.